Creating Charts
A quick overview of the most common tasks related to creating charts.
Install
Using CDN
Visit the CDN index for a list of available releases.
<script src="https://code.jscharting.com/latest/jscharting.js"></script>
Download
The latest release can be downloaded here.
Using npm
See npm package page for more information.
First Chart
For this first example, let's use the CDN. Add the script tag to the <head> section of your HTML page.
<script src="https://code.jscharting.com/latest/jscharting.js"></script>
In your HTML page, add a target div element for the chart to render in and set a CSS height value.
<div id="chartDiv" style="max-width: 500px; height:
300px;"></div>
Create an instance of a chart with some static data.
const chart = new JSC.Chart("chartDiv", {
  type: "column",
  series: [
    {
      name: "Teams",
      points: [{ x: "A", y: 10 }, { x: "B", y: 5 }]
    }
  ]
});

Edit in CodePen
Get data from CSV
JSC.fetch() is an alias for the standard JavaScript fetch() function and includes a polyfill for IE11. Use this function to effortlessly retrieve chart data from your disk.
JSC.fetch("./data.csv")
  .then(response => response.text())
  .then(text => {
    //Use csv text
  });
Data in CSV, TSV, or delimiter-separated values format can be converted to JSON. Refer to the fetch(), CSV, and JSON Tutorial for more information.
let data = JSC.csv2Json("date,actual,goal\n1/1/2023,5409,7000\n1/8/2023,4893,7000");
// ->
//[{date: 1672552800000, actual: 5409, goal: 7000},
//{date: 1673157600000, actual: 4893, goal: 7000}]
Map data to chart points
let points = data.map(d => {
  return { x: d.date, y: d.actual };
});
//-> [{ x: 1672552800000, y: 5409 }, { x: 1673157600000, y: 4893 }]
Render a chart using data
const chart = new JSC.Chart('chartDiv', {
// Set the X axis scale to time.
xAxis_scale_type:'time'
// Pass points to the series
series:[{ points:points }],
});
Edit in CodePen
Crash Course
(5 minute read to hit the ground running)
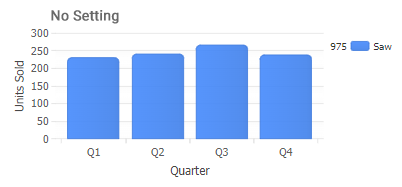
The JSCharting API is designed to be user-friendly. The chart selects default options that are intuitive, reducing the need for customization.
Chart Types
You can set chart types through the chart type property:
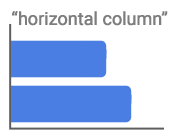
const chart = new JSC.Chart("divId", { type: "horizontal column" });
There are a variety of chart types, series types, and modifiers that can be combined in the "type" property.
Examples of chart types:
horizontal, pie, radar, map, organizational, calendar, full list
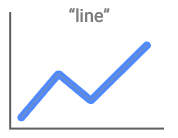
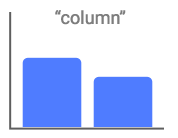
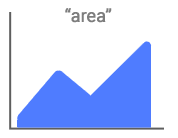
Examples of series types:
column, line, area, bubble, candlestick, full list
A few illustrated examples of type settings:

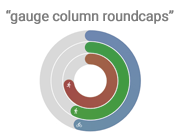
Overview Tutorial Chart Types Overview
Be sure to check out our chart types gallery for examples and usage guidance.
Chart Options
Chart options can be set in the chart constructor,
const chart = new JSC.Chart("divId", {
  /*options*/
});
or at any time after the chart is rendered.
chart.options({
  /*options*/
});
Property Expansion
JSCharting provides a declarative API with options such as
chart.options({ title: { label: { text: "title text" } } });
For convenience, property paths can be combined into single property names as shown:
chart.options({ title_label_text: "title text" });
Code Expansion Tutorial More details on property expansion
Hide the Legend
chart.options({ legend_visible: false });
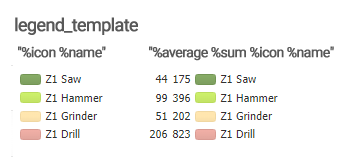
Legend Columns
// Less Detail
chart.options({ legend_template: "%icon %name" });
// More Detail
chart.options({ legend_template: "%average %sum %icon %name" });
Refer to the Token Reference Tutorial for a comprehensive list of over 54 available tokens, listed under the 'Series Tokens' section.
Try it out in this CodePen
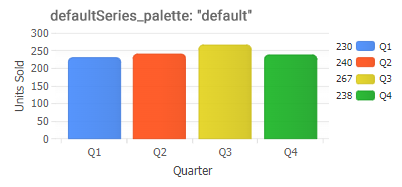
Legend Entries for Points
The code snippet below sets a series palette, which results in each point in a series having a corresponding entry in the legend box.
chart.options({ defaultSeries_palette: "default" });
Legend Tutorial Legend Tutorial
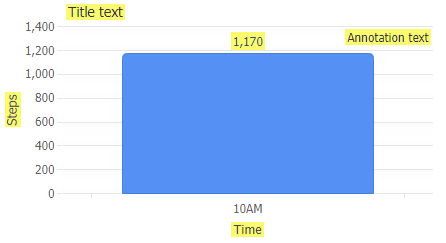
Labels
Here are a few examples of commonly used labels in charts.
chart.options({
  /* Title text */
  title_label_text: "Title text",
  /* Axis label text */
  xAxis_label_text: "Time",
  yAxis_label_text: "Steps",
  /* Point labels */
  defaultPoint_label_text: "%yValue",
  /* Annotations */
  annotations: [
    {
      /* Inside the chart area, top right corner. */
      position: "inside top right",
      label_text: "Annotation text"
    }
  ]
});
Labels Tutorial Using Labels
Chart with a button
Do you need a user interface control to adjust a chart setting or test a line of code in real-time?
Traditionally, you would have to create an HTML element and link its events to JavaScript code, but this process can be made much easier by using the integrated UI controls provided by JSCharting. This allows you to add simple UI elements without any HTML required.
JSC.Chart("chartDiv", {
  toolbar_items: {
    "Click Me": {
      events_click: function() {
        alert("Button clicked");
      }
    }
  }
});
Try it in CodePen.
UI Controls Tutorial A simple to use API to define interactive input elements rendered on a chart.