Blog
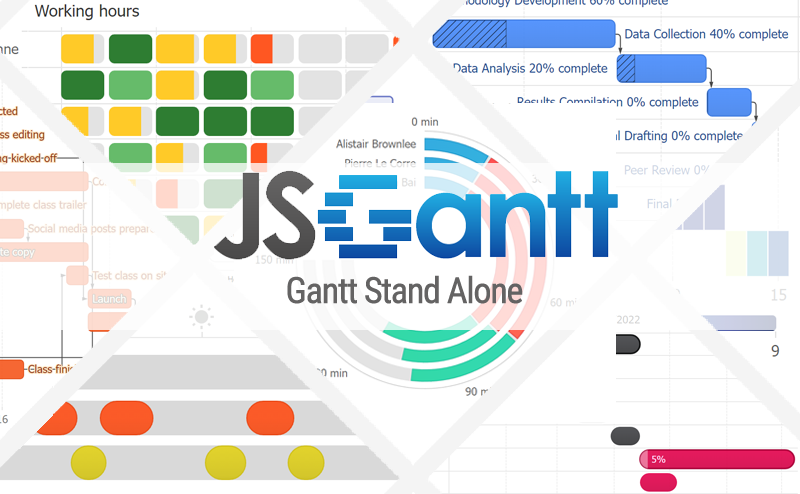
JSCharting Gantt Stand Alone
We are thrilled to announce an exciting new release for project management and data visualization - Gantt Charts by JSCharting as a standalone product!
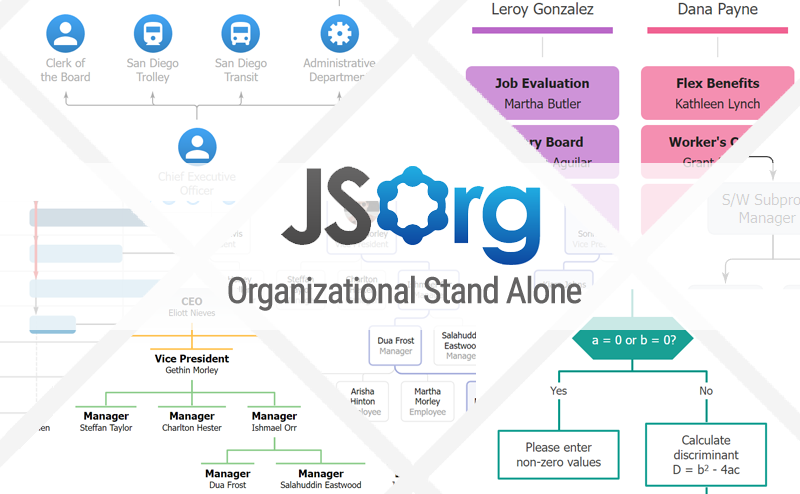
JSCharting Organizational Stand Alone
We are excited to announce a new development that will reshape organizational data visualization and planning – the launch of Standalone JS Org from JSCharting!
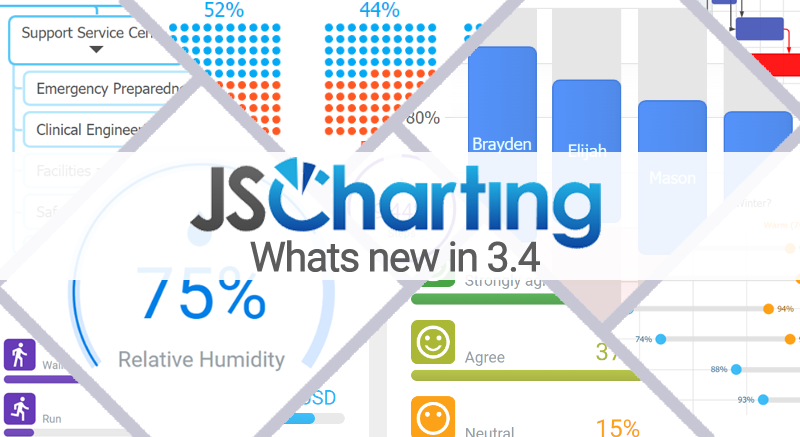
What’s New in JavaScript Charting 3.4
Version 3.4 brings new dashboard chart widgets with dark mode, vertical organizational chart layouts, slope charts, dumbbell charts, waffle charts, bullet charts plus new tick, axis and label features and much more.
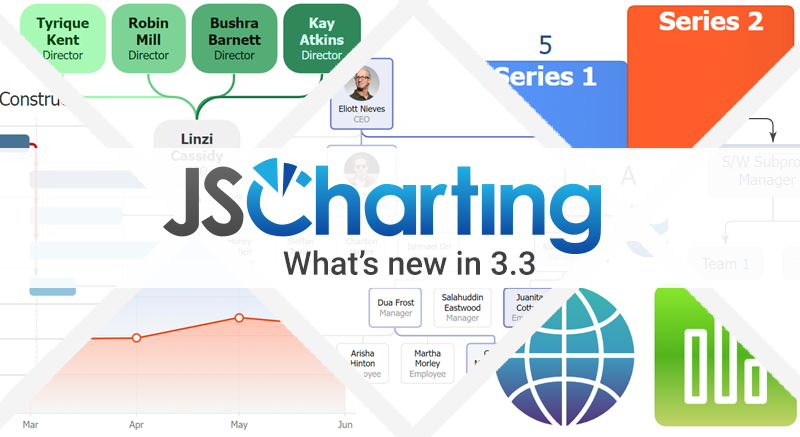
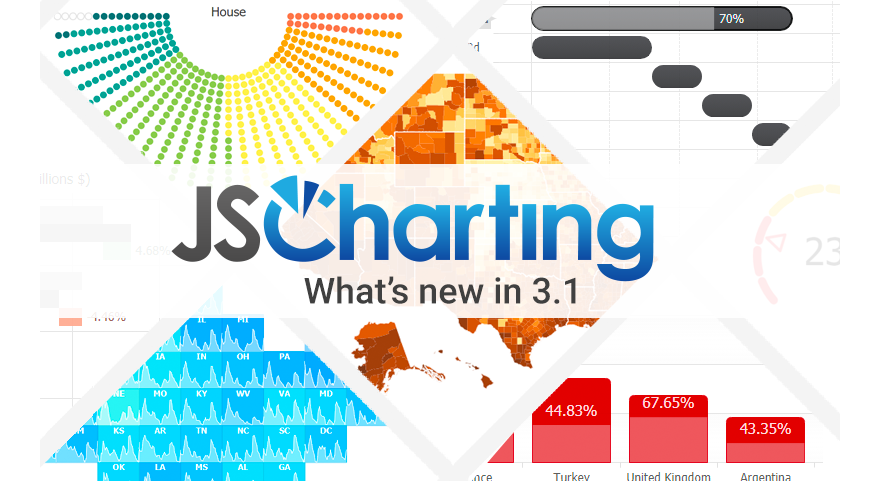
What’s New in JavaScript Charting 3.3
Version 3.3 includes organizational, Gantt, chart widgets, pictograms, gradient features plus over 50 new samples.
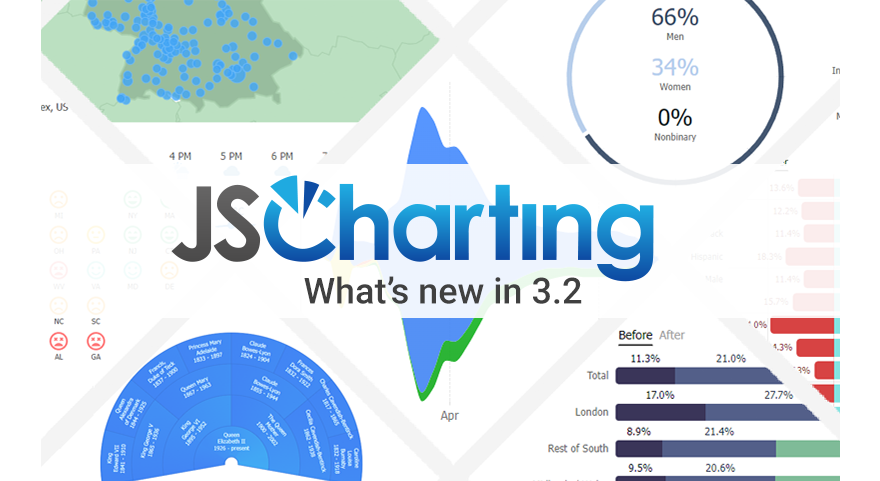
What’s New in JavaScript Charting 3.2
Version 3.2 New numeric value and label animation, shape labels and many powerful new chart examples.
What’s New in JavaScript Charting 3.1
Version 3.1 includes advanced new features and powerful samples to quickly visualize your complex data.

6 Best Front-end JavaScript Frameworks: Multi-Year Developer Surveys Visualized [2021 Update]
A plethora of front-end JavaScript frameworks and JS libraries have been created by developers, for developers.

Venn and Euler Diagram Challenge with prizes!
To celebrate the new chart type additions of JSCharting 3.0 we are launching a Venn and Euler Diagram challenge where top entries will win free licenses.
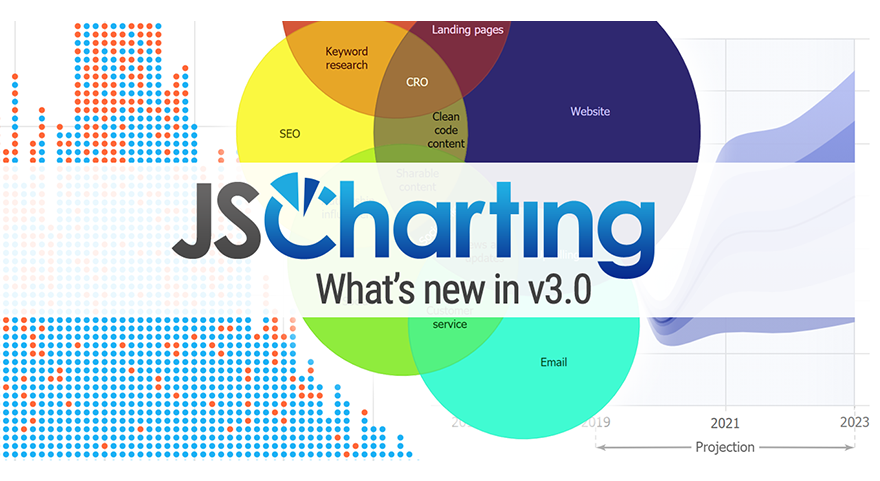
What’s New in JavaScript Charting 3.0
Version 3.0 includes major new features including the Venn chart type, RTL (Right-to-left) language support, advanced highlight and selection and much more. New interactivity and event features provide seamless data highlighting and UI interactions. The JSCharting team has included advanced dashboard examples using the new version 3.0 API, allowing you make your own high performance dashboards quickly and easily.

iOS vs Android COVID-19 Mobility Visualized
The JSCharting team created an interactive COVID-19 Mobility Dashboard to help citizens visualize mobility data for their own countries and compare results to countries with different policies as the world unites to fight COVID-19.
COVID-19 Dashboard with Animated Time Series, Interactive Country Comparisons and Summary Views
The JSCharting team created an advanced interactive COVID-19 dashboard to help for citizens throughout the world, as we unite to fight COVID-19
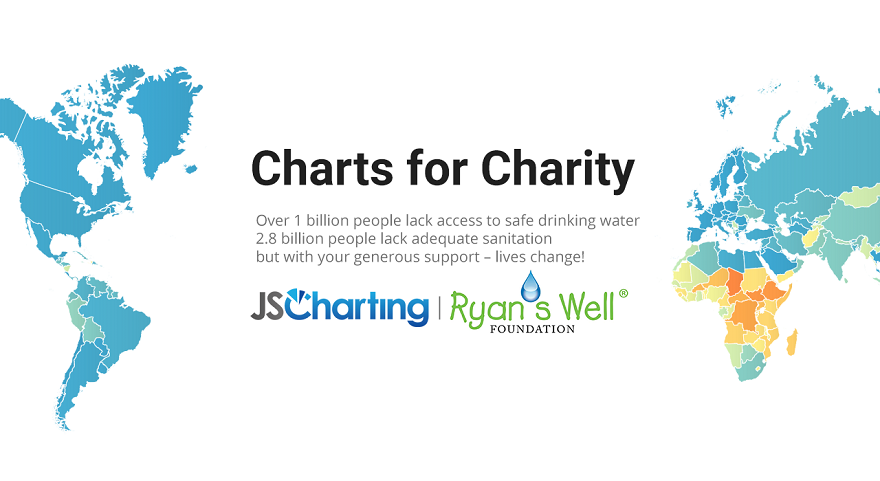
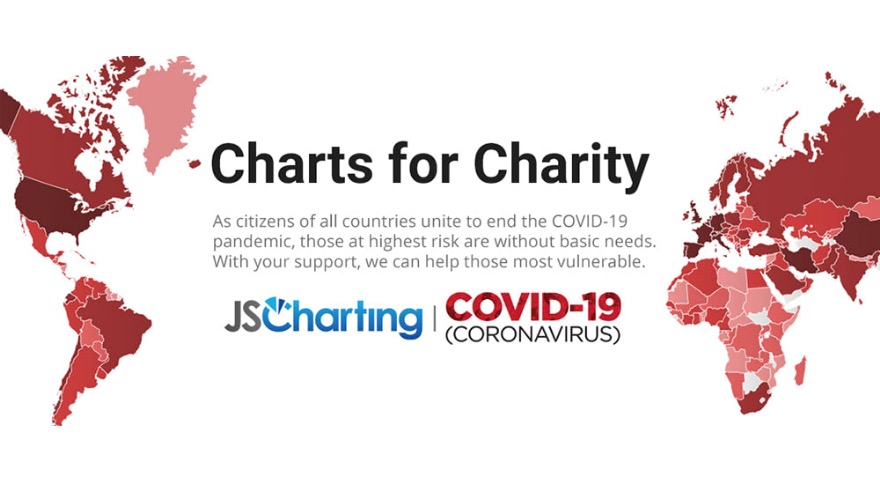
Charts for Charity: Pay What You Want for JSCharting with 100% of proceeds donated!
For a limited time the JSCharting 8 in 1 bundle is being licensed for whatever you want to pay, with all proceeds being donated to Ryan’s Well Foundation.

How VR Software Can Boost Data Visualization
Data is everywhere. Gathering data is the initial challenge and the next is transforming that data into useful information through analysis and classification.
Version 2.9 Released | JSCharting
JSCharting 2.9 includes a redesigned look and feel and a more convenient API, providing cleaner modern charts that communicate your complex data even more effectively.

The Most Important JavaScript Code Editors
A deeper dive into the most important JavaScript Code Editors and what may be best for you.

Bullet Charts - What Is It And How To Use It
The bullet chart has been described as a secret weapon for effective and efficient financial analysts that contains the necessary information, while maintaining flexibility and visual space savings.

NBA Final 2019 Toronto Raptors vs Golden State Warriors Data Visualized
The Toronto Raptors are in the NBA playoffs for the first time.

James Holzhauer's Final Jeopardy Run Visualized
As the world watched on Monday, american quiz show phenom, professional gambler and Jeopardy contestant James Holzhauer's record setting run fell just short of Ken Jennings total cash winnings record.
Version 2.8 Released | JSCharting
Version 2.8 is one of our most significant releases to date. The JSCharting team focused its energies innovating the chart axes, accessibility support, a seamlessly integrated datagrid control and many more additions.

Understanding Bar Charts and Column Charts
Bar and column charts are one of the easiest and most accessible ways to represent your data in a visualized, easy-to-read, and understand format.
Version 2.7 Released | JSCharting
New chart types and features in v2.7 release.
Version 2.6 Released
New chart types and features in v2.6 release.

JavaScript Dashboards, Gauges and Sparklines Demystified
Dashbord is one of the most important tools of data visualization, and its frequent components such as Gauges and Sparklines.

Understanding Trading Charts
Financial stock charts suck as candlestick, open-high-low-close (OHLC) and line in the world of trading.
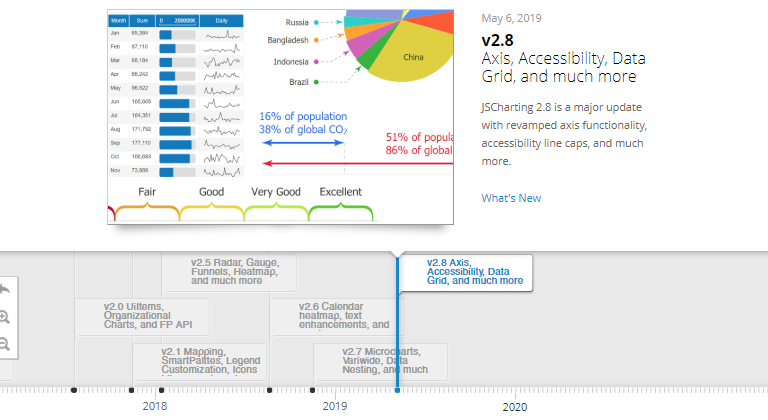
Complete Release Timeline
All the JSCharting releases are summarized in our interactive product timeline which can be viewed here.

The Importance of Data Visualization in Business
Data Visualization in business helps people understand information quickly, businesses develop better strategies to improve their performance and decision making.

Improving Customer Experience (CX) with Data Visualization (DV)
Customer experience is key to modern business and Data visualization is a critical component to deliver consistent customer experiences.

Pie charts in modern data visualizations and when they should be avoided
Pie charts have their place in modern data visualizations and even excel in certain areas, but need to be used with caution.
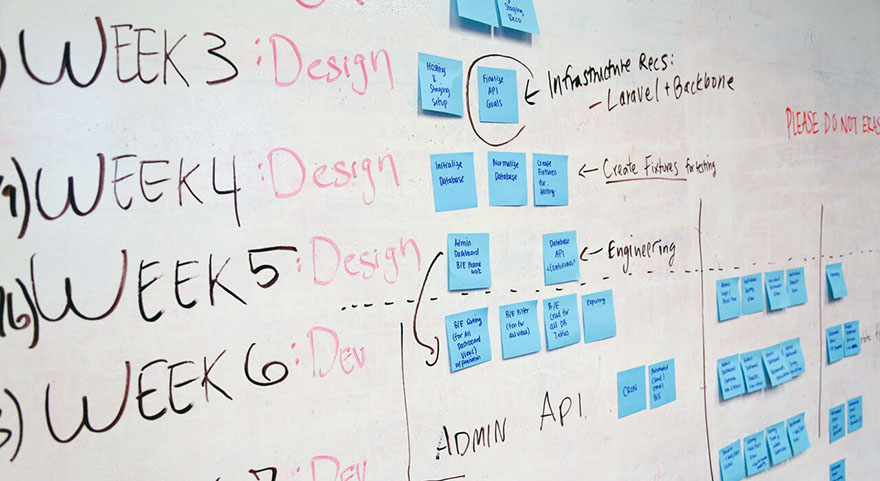
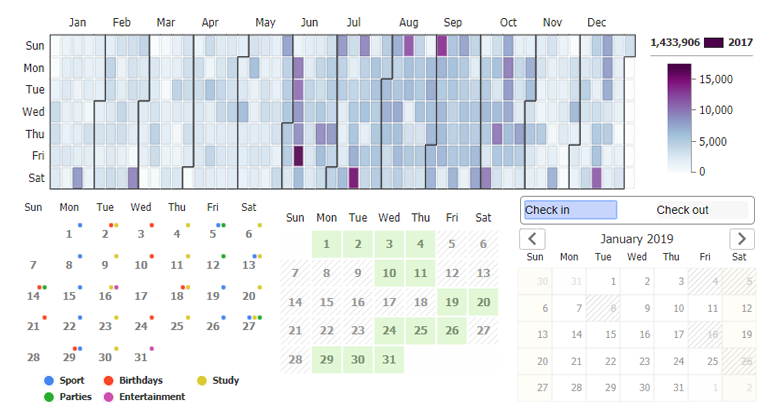
Essential Guide to Gantt Charts
Gantt charts are ideal project management tools that excel at the visual representation of task hierarchies and communicate real-time progress to project managers and team members alike.

Understanding Pyramid Charts, Funnel Charts and Cone Charts
Pyramid, Funnel and Cone Charts to classify items, to represent the varying sizes and quantities of an item, to demonstrate the steps of a process.

5 Best JavaScript Editors: Developers rank the best tools worldwide
List of the most popular JavaScript editors rated by developers around the world: Visual Studio Code, Sublime Text, VIM, WebStorm, Atom.