Version 2.9 delivers a major step forward for chart aesthetics by implementing a more minimal and function-orientated design approach. Along with overall cleaner visuals, new features have been added to aid in reducing distracting chart elements such as legends and labels. These elements can now be easily integrated into data point visuals themselves, which significantly improves chart readability.

New Modern Look
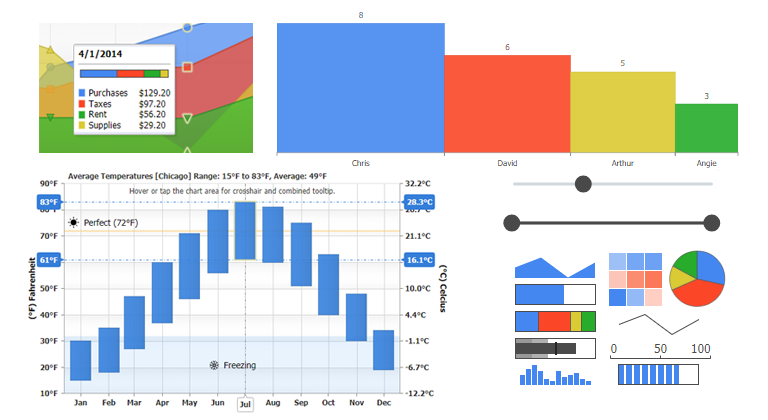
The JSCharting 2.9 release includes revamped default chart styling that results in a cleaner and more modern look while focusing the viewer on the underlying data being visualized.

First & Last Point Settings
This feature provides a mechanism to simplify chart visuals and to communicate data more intuitively. A legend is no longer necessary to define the series and values. For example, a series name can be shown on the first data point of each series and the last value on the last data point. It is also useful in conjunction with point axisTicks: Example

Axis Tick Label Auto-Wrapping
In some scenarios, the best way to fit axis tick labels on a chart is to wrap them. In this release, tick labels will wrap automatically when the chart determines it is practical to do so. This can be disabled manually with the label autoWrap property and is automatically disabled when the label contains <br>.

DefaultAxis Option
This new property provides a way to quickly apply settings for all axes on a chart using a single property. It makes it convenient to apply options for items such as tick labels which commonly share styling.

Axis Scale minInterval Option
A minimum interval setting lets the chart calculate a suitable interval while limiting the range that the automatic intervals are selected from. It is useful in scenarios such as a numeric axis displaying years (i.e. 2018, 2019, 2020). Setting the minInterval to 1 ensures the axis doesn’t show decimal places like 2018.5 2019, 2019.5, and so on.

Point AxisTick axisId Setting
It is now much easier to have points with axisTicks when there are multiple axes these ticks could apply to. Simply specify the axisId and the chart will place these ticks on the specified axis.

Spline Tension Option
A new option [series.line.tension] allows adjustments to spline series type tension. This is useful to adjust the spline visual and how closely it tracks to a straight line.
 helper function for custom fonts")
JSC.fontsReady() helper function for custom fonts
The new fontsReady() thenable helper function provides a mechanism to utilize 3rd party fonts such as google fonts inside charts. It ensures the fonts are ready to be measured by the chart before the chart begins rendering and does not require any further layout adjustments.
 helper function waits until page is loaded")
JSC.ready() helper function waits until page is loaded
A thenable utility function similar to jQuery.ready(). It returns a promise that all webpage markup and resources are fully loaded.

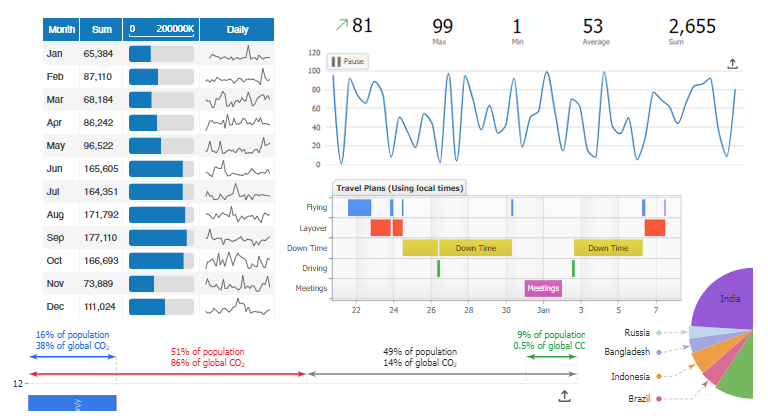
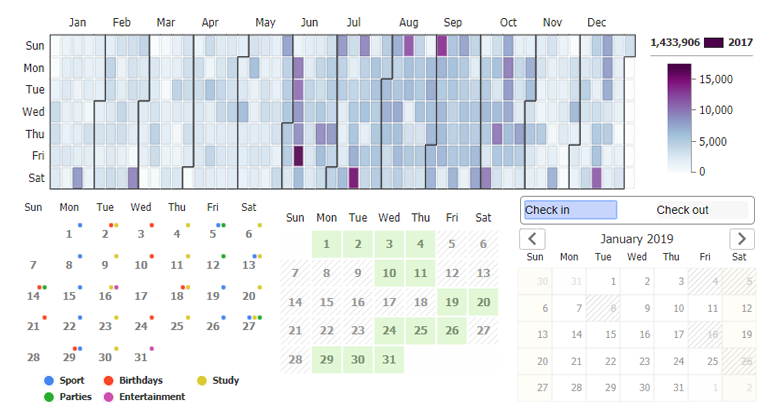
Superimpose Visuals with <absolute>
Microcharts can now be wrapped inside an <absolute> tag which allows overlapping several visuals such as sparklines. This provides a more in-depth expression of data inside charts such as calendars.

Debug Notifications
A new debug notification has been added on the chart which provides hints and tips on how the chart can be further optimized or improved.

Improved Auto Tooltip Text
The default JSCharting tooltips have been improved to automatically provide more useful and relevant information depending on the chart type and data that is shown.

Improved Point Coloring System
In addition to the existing data point color properties JSCharting 2.9 adds point.fill and marker.fill in order to give developers full control over the color scheme and colorizing of data point visuals.

Point Color Adjustment Values
A point coloring scheme can now be defined with settings such as outline_color: 'darken' and several other keywords that can be used as defaults and will ensure all series, regardless of their color, will look similar.
JSC.defaults() to apply default settings for all subsequent chart instances
A mechanism designed to provide application of system-wide settings. It can be used to define styling or any other settings that all charts should use. This can also be used within a module that wraps the chart to specify the location of chart resources in a single location.
New Chart Events
New events have been added to the chart to enhance custom interactivity including:
zoomed- fires after chart zoom has been performed.scrolled- fires after the chart area has scrolled.mouseOver- fires when the mouse enters the chart.mouseOut- fires when the mouse leaves the chart.
Revised and Updated Samples
Hundreds of chart samples have been revised and updated to demonstrate more real-world usage cases and to leverage the latest API features of JSCharting.
Disable Microchart Pixel-Snapping
A new microchart setting ‘antialias’ allows disabling pixel snapping which can be useful with some micro charts such as columns to ensure they fill in the exact size of the chart specified.