Features
JSCharting's unique features aren't just focused on stronger looking charts—they also save you time and wow your customers!
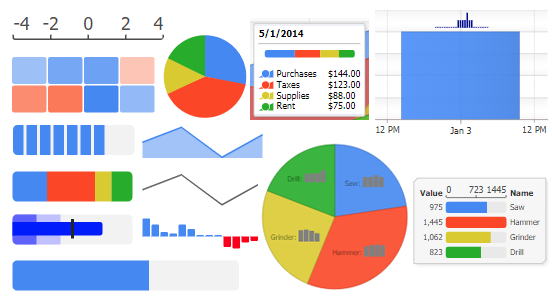
Sparklines and Mini charts
JSCharting has extensive small chart support performance optimized for thousands of charts per page. Now it's simple to add charts inline in your tables and grids as sparklines are often used, but JSC support goes much further, allowing usage inline in labels, annotations and more. This powerful functionality is useful in all charts, but particularly powerful when used within dashboards. With over 10 sparkline and microchart types and variations seamlessly integrated, it's never been quicker or easier to visualize complex data in an intuitive and non-obtrusive way! As always, all these new chart types are included bundled with your JSCharting license at no additional cost.
JS Mapping Charts
Each JSCharting license includes the full suite of JSMapping functionality at no additional charge. Access an advanced an highly tuned set of maps for all countries / states / provinces in the world with no special coding or mapping expertise required. Advanced thematic mapping, map overlays, and dynamic loading are supported; to learn more view the feature and gallery samples.
Legend DataGrid
JSCharting's powerful token system can now be leveraged in legends with automatic scaling and advanced text sizing. This creates compelling legend grids to clearly communicate tabular data represented in the chart. While tooltips effectively serve usage cases with dynamic charts, legend grids are particularly useful for charts that will ultimately be printed or consumed in documents where such interactive features are no longer available.
Programming Features
UiItems
Add input controls (custom user interface) to a chart effortlessly to make your visualizations more dynamic and functional. This is particularly useful for enabling end users to select which data to display, viewing the data in a different way, or any optional settings that will help them visualize your data in the most efficient and intuitive way. The JSCharting API for adding uiItems makes such additions much simpler than using HTML input controls, even when using jQuery. In addition, charts are not bound to external HTML controls and can be moved to any page easily without losing full user interface functionality.
Label Features
Functional Programming API
Intuitive development with the chart or any items within it is easier than ever with the new functional programming API. Nearly everything can be updated with the same configuration settings used to initialize a chart, significantly reducing the API surface area. Selecting specific items to update, then updating them, has been reduced to simple code that reads more like spoken language making it easy to learn and offering a much more efficient way to develop.
Programming Features
Label Tokens
Tokens can be used in labels to represent values and offer a much simpler way to manipulate label text.
Label Features
Code Expansion
Automatic code expansion allows aliasing any property by typing it out in a single name. The chart will detect and expand the properties automatically. This feature can save a large amount of time by eliminating additional keystrokes necessary to achieve the same property settings without code expansion.
Programming Features
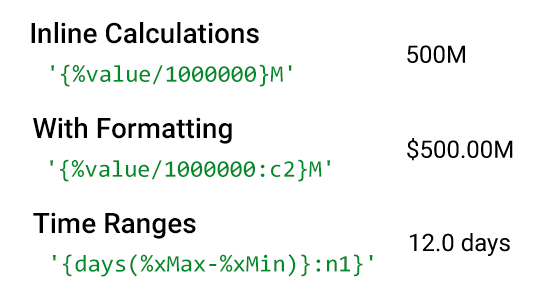
Label Expressions
Advanced label calculations with custom formatting and time range support can be set using simple to understand expressions. Save extensive coding for label formatting using the integrated seamless functionality provided with JSCharting.
Smart Tooltips
The chart detects the type of data being used and automatically creates useful and informative tooltip.
Globalization & Formatting
Effortless globalization enables quick and easy labeling in any language. A complete format string set is available and supports all numeric and date formats, including custom format strings. Combined, formatting and culture settings will automatically generate labels ensuring correct formats without requiring familiarity with the details of any language.
Inline Formatting
Specific token formatting can be inlined with a label's text.
Smart Category Data Grouping
Datasets with partial or missing category data will be evaluated through a specialized algorithm to detect what the intended order of such a series may be. When such data is used with a chart, it will save a great deal of time by interpreting it automatically.
Data Features
Arbitrary, Relative, and Docked Annotation Positioning
Annotations can be used as labels or annotations and can be placed anywhere on the chart relative to the chart top left corner, or the chart area's top left corner. In addition, annotations stack when docked to any chart area corner or side.
Browser Compatibility
A wide range of browsers and devices are supported.

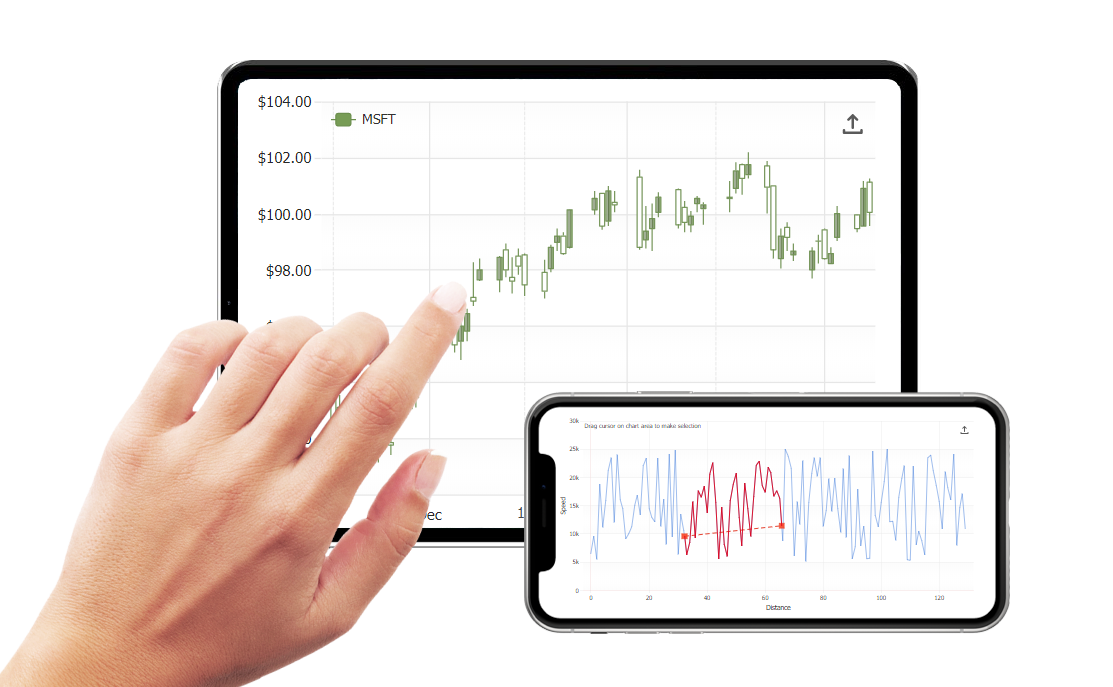
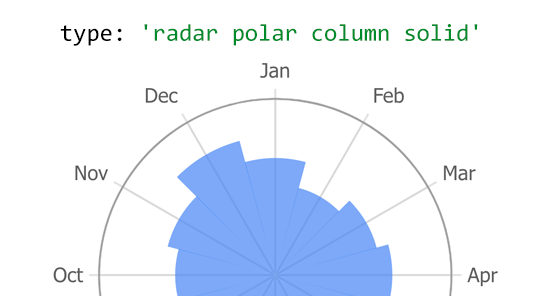
Chart Types
Includes an impressive array of chart types with custom tuned visuals to have a great visual impact without special settings or tuning required.
Visit the gallery to see them all.
Chart Types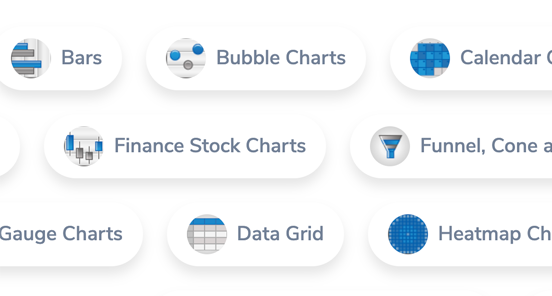
Aesthetically pleasing visuals
Beautifully rendered visuals.
Real-Time Charts
Interact with charts at the user or developer level in real-time (adding data in with built-in dynamic axis animations).
Some interactive features include:
Interactivity
Several default interactive behaviors are available with any chart. The charts are not however limited to these behaviors because a complete set of event handlers is also available.
Interactivity Features
Setting Chaining
Quickly and easily set deep hierarchies of advanced chart types and other settings with a single line of code simplifying development and saving time and development cost for your visualization projects.