
Lines, Splines and StepLines

JavaScript Chart Types

Lines, Splines and StepLines

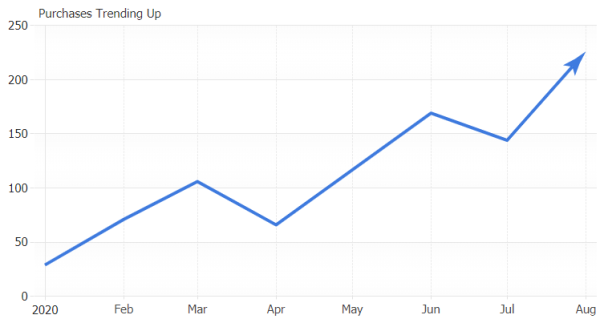
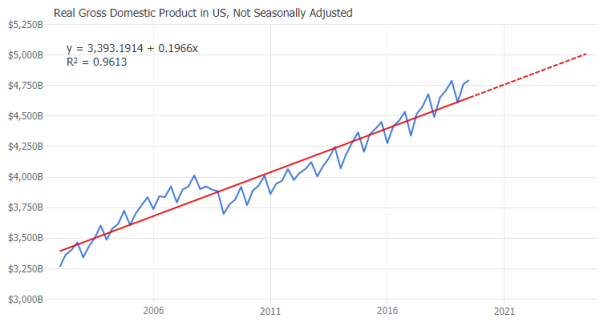
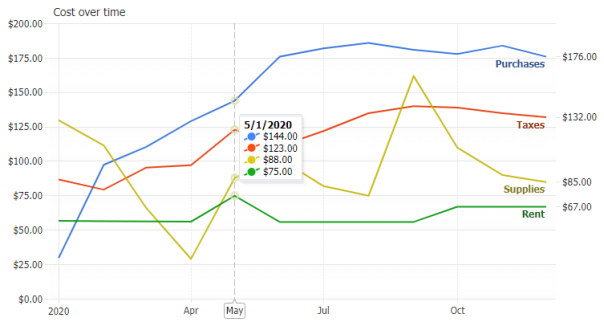
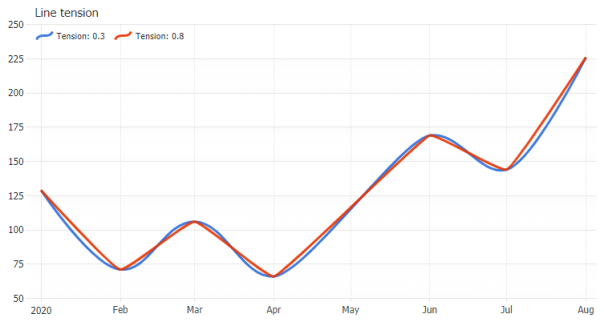
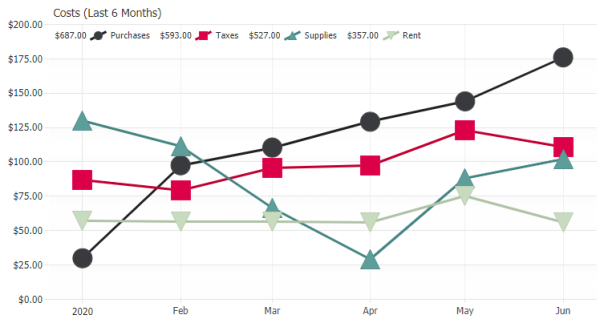
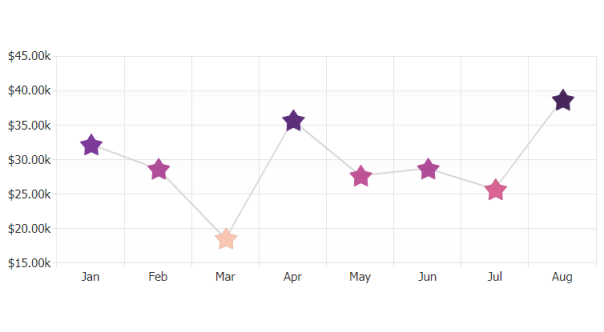
JSCharting includes extensive line support with custom makers, dash styles, dynamic data-connected markers, line only, empty element and line fit varitaions including stepline, straight line and spline visualizations.

Bump Chart Line Rank Trends

JavaScript code editor ranking over time.

Edit
Line Types Chart

This sample demonstrates different main line series types.

Edit
A styled line chart with time x axis scale.
Line chart with arrow caps.
Boy and girl baby name rankings over time.
Multiple charts comparing company gross and net revenues.
Linear trendline calculation with prediction and r squared value.
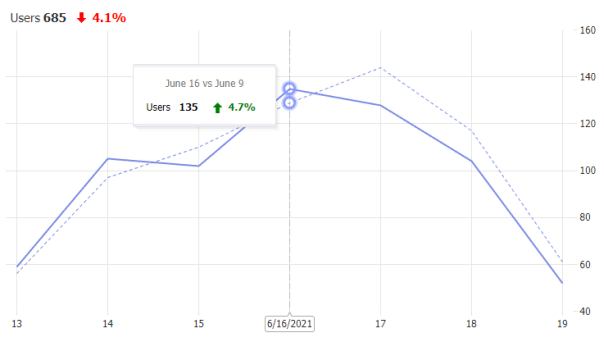
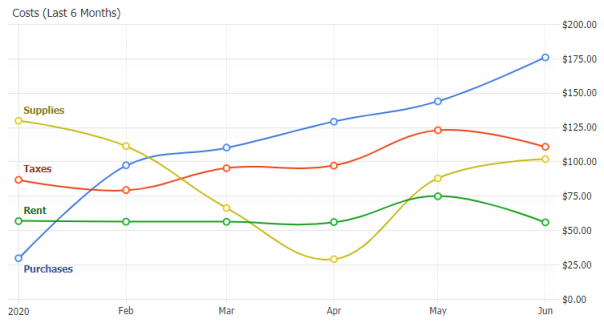
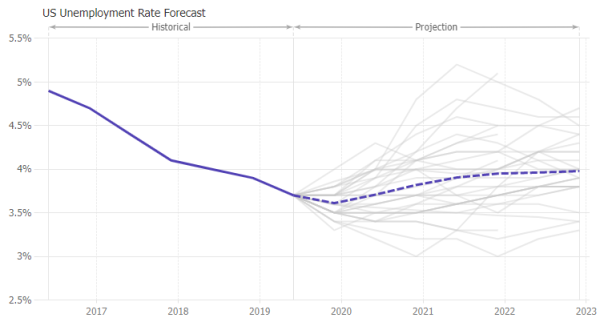
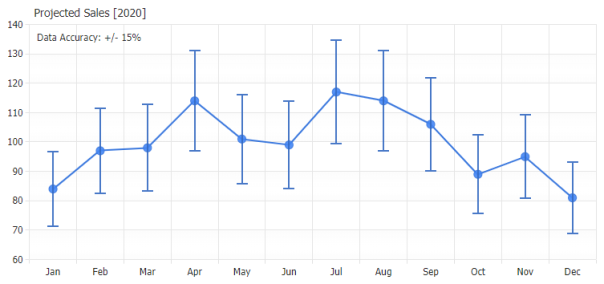
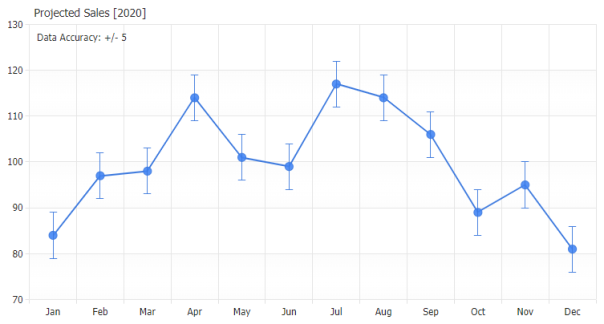
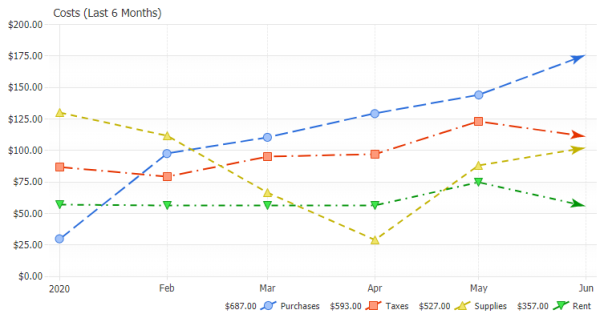
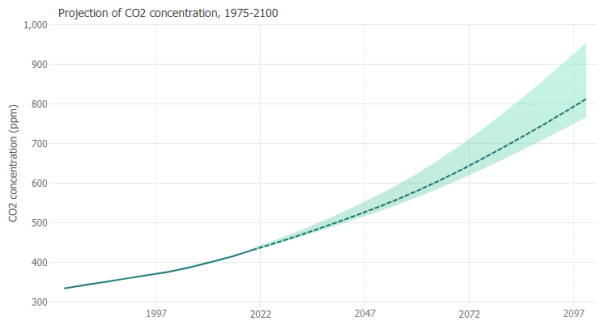
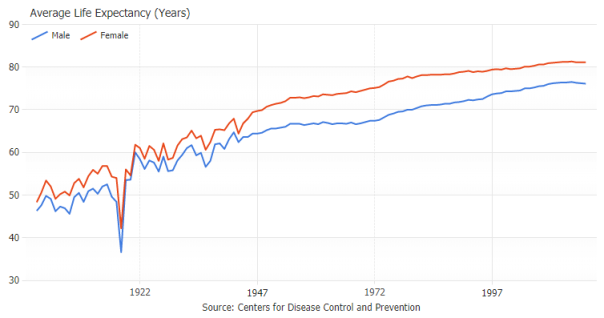
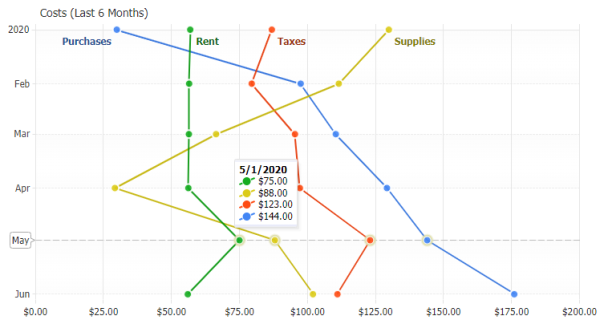
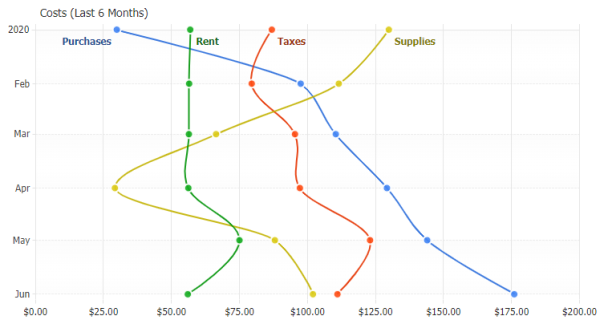
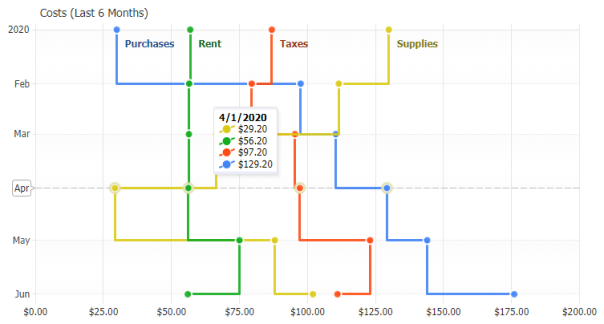
A multidimensional trend line chart that compares two time periods.
Line series type with no markers.
Demonstrates line tension options of spline series type.
Muted vector segments that appear on hover or when selected with a drop down.
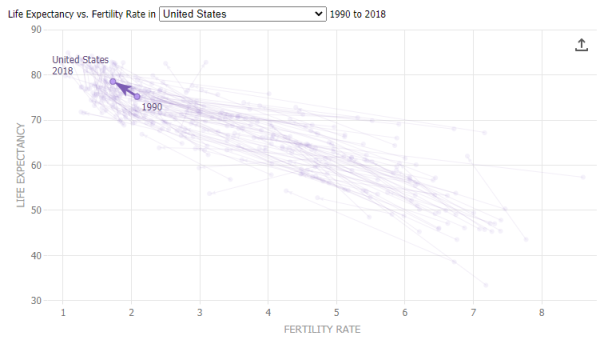
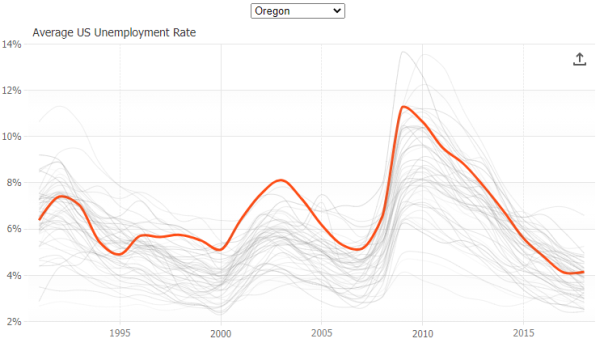
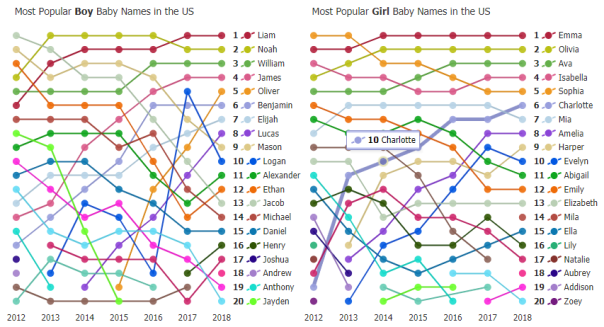
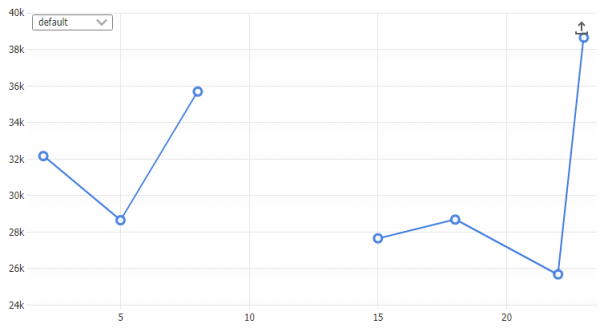
Uses series selection to highlight line series in sync with a dropdown control.
Spline series types.
A line projection making up the average of many projection lines.
A computed line series with muted source lines for context.
Line chart of phone prices.
Line chart with styled error bars.
Stepline series types.
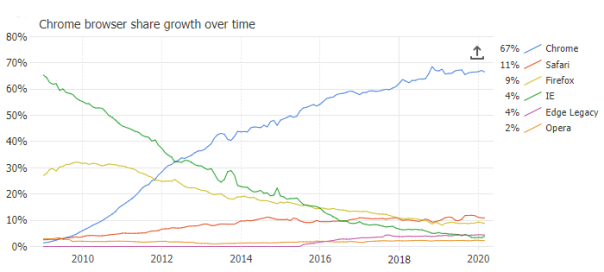
A JavaScript line chart with multiple series illustrating Chrome browsers rise to dominance over time.
Line series with default offset error bars.
A line series type with styled lines.
A line chart used to illustrate a concept.
Line chart using CSV data file.
Time scale line chart with error bars.
An uncertainty line projection chart.
Line chart loaded from a CSV data web service.
A line series type with large markers.
A Line series type with large dynamic point color markers.
A line series with missing points.
A horizontal line chart with styled markers and crosshair.
Horizontal spline series types.
Horizontal stepline series types.
A line series with different color markers.