Error Bar
Describes error bar functionality and features.
Introduction
A number of series types also support error bars. Error bars are associated with points and defined under the subvalue point property. In addition to this property, there is also a subvalueX property that can be used to show the same error values but on the X axis.
subvalue JSON Configuration
Example error bars
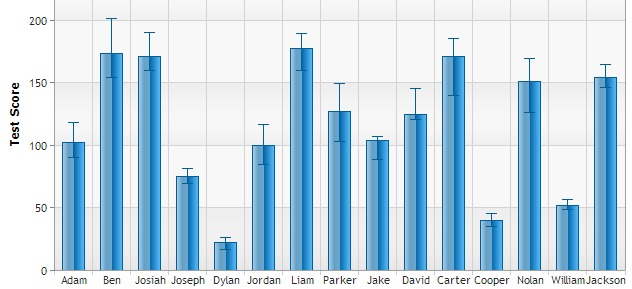 Figure 1.
Error Column Chart Sample Column series with error bars.
Setting Range Values
The subvalue.range property can be set as an array of high and low values as shown below.
{
  series: [
    {
      points: [{ name: "Nolan", y: 16, subvalue: { range: [15, 18] } }]
    }
  ]
}
Time Line Error Sample Time scale line chart with error bars.
Setting Offset Values
A numeric offset (subvalue.offset) can also be used to specify the range as the point's y value + and - the offset.
{
  series: [
    {
      points: [{ name: "Nolan", y: 16, subvalue: { offset: 5 } }]
    }
  ]
}
Line Error Offset Sample Line series with default offset error bars.
Setting Percent Values
A percentage offset (subvalue.percent) can also be used and indicates the error range is + and - that percentage of the point's y value.
{
  series: [
    {
      points: [{ name: "Nolan", y: 16, subvalue: { percent: 5 } }]
    }
  ]
}
Line Error Styling Sample Line chart with styled error bars.
Setting Multiple Values
Multiple values (subvalue.percent) can also be used in cases like box and whisker plots.
{
  series: [
    {
      points: [{ name: "Nolan", y: 16, subvalue: { values: [5, 8, 12, 20, 25] } }]
    }
  ]
}
Styling
The subvalue.line property provides setting to allow styling the error bars. The following sample demonstrates these styling options.
Line Error Styling Sample Line chart with styled error bars.