Radar
Radar type specific features.
Radar Types
There are two types of radar charts which are both set through the chartType enum.
- Spider
A spider radar chart is drawn using lines connecting the Y axis end points. - Polar
A polar radar type is drawn as a circle.
By default this setting is automatic. If the x values of the series are numeric or time based, a polar type is used. If the values are strings, the spider radar chart is utilized.
This type can be specified with the chart type setting of 'radarSpider' or 'radarPolar' as follows.
{
  type: "radar spider"
}
Angles
Starting angles can be used with radar charts.
{
  defaultSeries_angle: 45
}
Axis Settings
Single Radar Axes
In a single radar chart, the main chart config properties chart.xAxis and chart.yAxis define the radar axis settings.
The following code specifies scale ranges for the X and Y axes on the radar chart.
{
  /*Single Radar Chart*/
  type: "radar",
  yAxis: {
    scale_range: [0, 100]
  },
  xAxis: {
    scale_range: [0, 360]
  }
}
Multiple Radar Axes
Each radar can have its own X and Y axes. However, if an axis is not specified for the series, the main axis or the first axis in the x or Y axis array is used.
{
  /*Multiple Radars */
  defaultSeries_type: "radar",
  yAxis: [
    {
      /*The main/default Y axis.*/
      scale: {
        range: [0, 400],
        interval: 100
      }
    },
    {
      id: "y2",
      defaultTick_gridLine_color: "blue"
    }
  ],
  xAxis: [
    {
      /*The main/default X axis.*/
      defaultTick_label_color: "orange"
    },
    { /*The 2nd X axis.*/ id: "x2", defaultTick_label_color: "blue" },
    { /*The 2nd X axis.*/ id: "x3", defaultTick_label_color: "green" }
  ],
  series: [
    {
      /*First series doesn't assign axes, so default X and Y axes are used.*/
    },
    {
      /*Second series uses the second defined X axis, and the default Y axis.*/

      xAxis: "x2"
    },
    {
      /*Third series uses the third defined X axis, and the second defined Y axis.*/

      yAxis: "y2",
      xAxis: "x3"
    }
  ]
}
The above code creates the following radars.
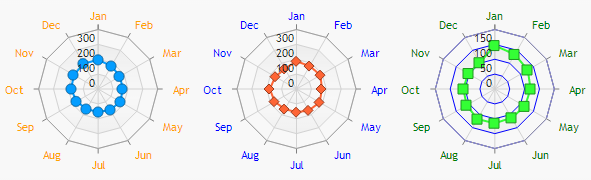 Figure 1.
Axis Markers
Radar axes offer standard axis markers support for both X and Y axes.
Styling
The series shape property allows setting the fill of the individual radars the series is plotted on.
{
  xAxis: {
    lineWidth: 2
  },
  series: [
    {
      name: "William",
      shape_innerFill: "#fff0f0"
    },
    {
      name: "Elliot",
      shape_innerFill: "#f0fff1"
    },
    {
      name: "Andrew",
      shape_innerFill: ["#a0f1ff", "white", 45]
    }
  ]
}
The above code produces the following result:
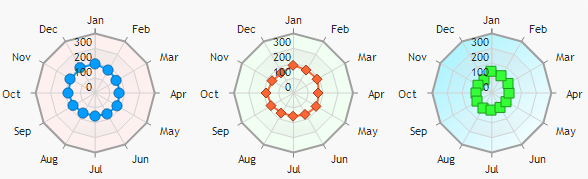 Figure 2.
Layout
Default Layout
Radar layout uses an algorithm that determines the most efficient number of columns and rows to maximize radar sizes.
As radars may have varying point labels lengths, this can interfere with the automatic layout system.
Tweaking radar layout
The series shape property which refers to the series.shape config settings offer a number of settings to allow manual layout adjustments.
Applying the following adjusts radars positions. These values are given as 'x,y' in pixels.
{
  series: [
    {
      /*...*/
      shape_offset: "70,20"
    },
    {
      /*...*/
      shape_offset: "-70,20"
    }
  ]
}
Padding Radars
In cases where radars or other similar series are too crowded, a general padding value can be applied for all radars on the chart.
{
  defaultSeries: {
    shape_padding: 0.2
  }
}