JavaScript Chart Library
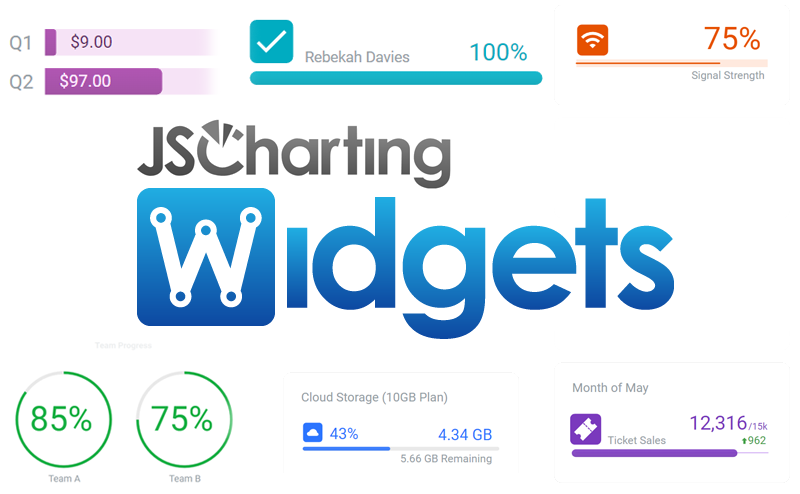
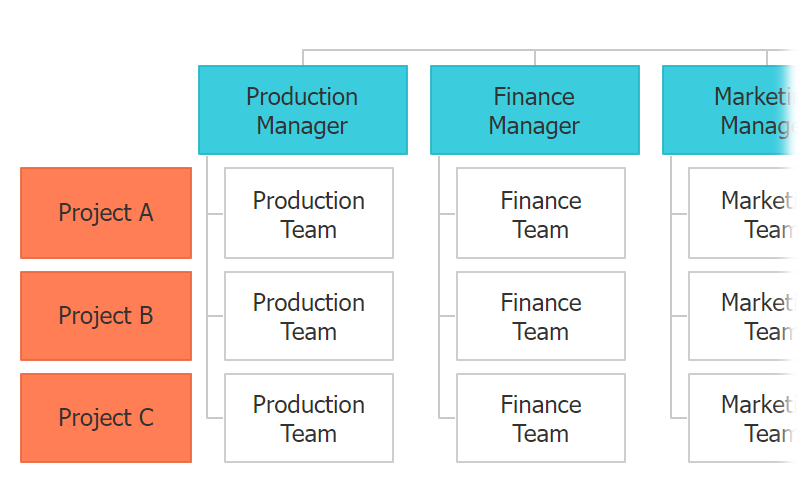
Every JSCharting license includes the full suite of 150+ advanced chart types plus interactive stock charts, seamless grid and calendar support, JavaScript maps, Gantt charts, JavaScript Org Charts and micro charts and dashboard widgets.
Explore JSCharting
Chart Types
A chart for every need with a simple and intuitive API.
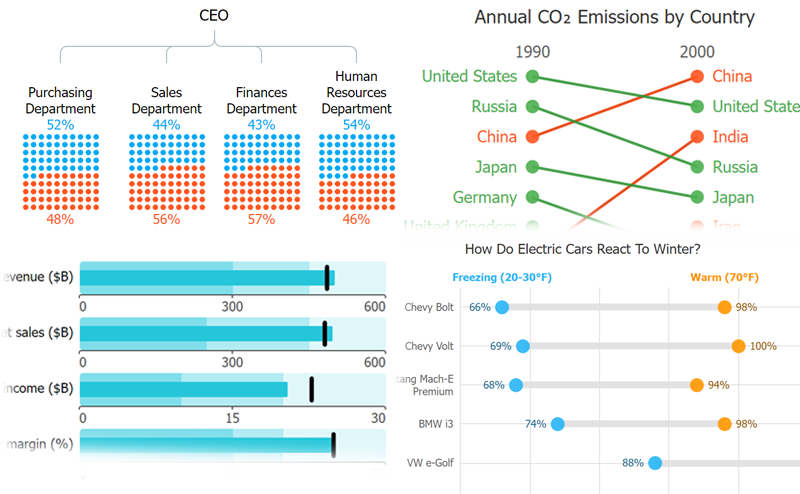
The JSCharting chart library includes all major chart types plus advanced chart types; from maps to stocks, dashboard gauges and KPIs to specialty calendar charts, Gantt charts and even Venn Diagrams you are covered with one library for all your future needs. JSCharting greatly simplifies chart types through an intelligent and developer friendly API, so when you use one chart type, working with another is quick and intuitive with minimal code changes (often as simple as changing the chart type string)!
Mobile and Responsive JavaScript Charts
Any Chart; Anywhere: Resolution independent SVG and HTML5 charts
JSCharting renders cleanly on all devices from mobile phones and tablets to desktops and laptops through native vector SVG [responsive charts] that always look their best. Use pinch to zoom on touch devices, zoom in desktop browsers and cleanly render on HiDPI monitors and in print with no jaggies or pixels visible.
Animations are seamlessly integrated and provide high performance visual context powering up to the second dynamic dashboards. Modern, clean and engaging design helps developers to create stunning interactive charts and data visualizations quickly and efficiently.

Interactive Charts
JSCharting interactively allows you to connect different chart types and actions with ease.
Jump from maps to microcharts, drill down and into your data and utilize dynamic zoom and framing to highlight data and selections for subsequent charting with other chart types. Together these building blocks can be used to create engaging modern dashboards.

Financial Summary
Total number of shops worldwide

Financial Summary
Total number of shops worldwide


Why JSCharting
Comprehensive
More than you need, just in case
- Gantt, org, calendar, and more—all in one
- Maps with all countries/provinces built-in
- Integrated data grid control
- Light weight microCharts and sparklines
- Library of useful SVG icons and graphics
- Widget module with simplified API and Visuals
Efficient
Start faster, finish sooner
- Refined auto API: fewer settings; less code
- Charts look and feel right by default
- 100s of examples to learn and reuse
- In-depth documentation—API & tutorials
- Advanced developer support/guidance
Interactive
Designed to interact
- Integrated UI controls
- Modify/animate everything
- Touch and mobile optimized
- Responsive (resizes to fit container)
- Automatic accessibility compliance
- Point, legend, and axis hover actions


