JavaScript Mapping Charts
JavaScript Chart Types
JavaScript Mapping Charts
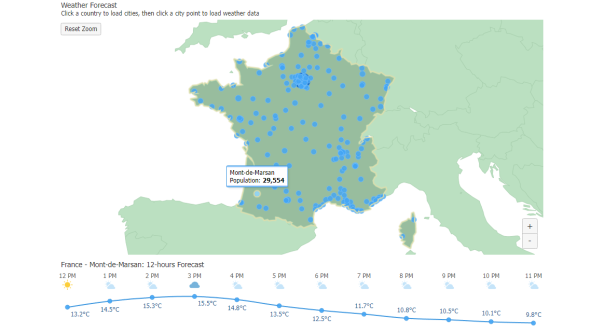
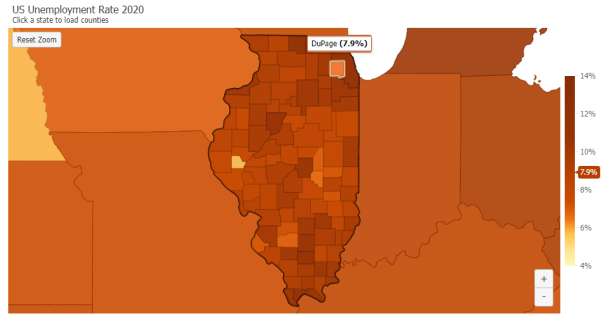
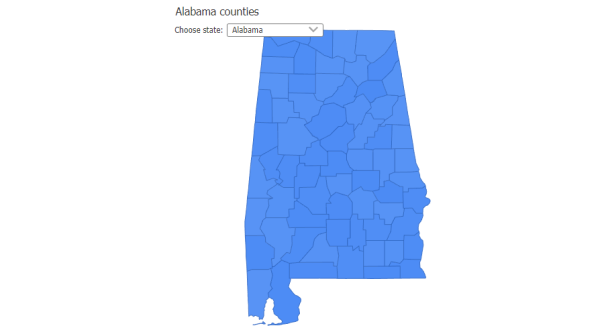
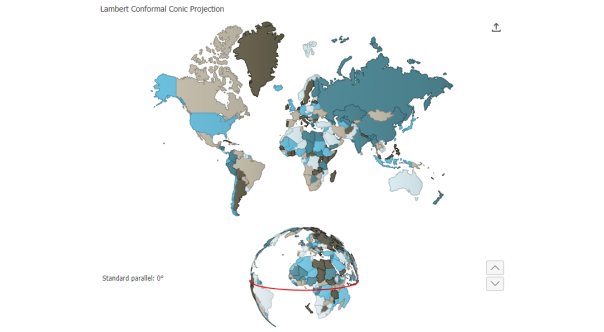
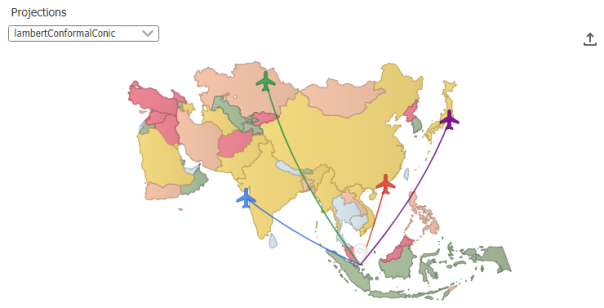
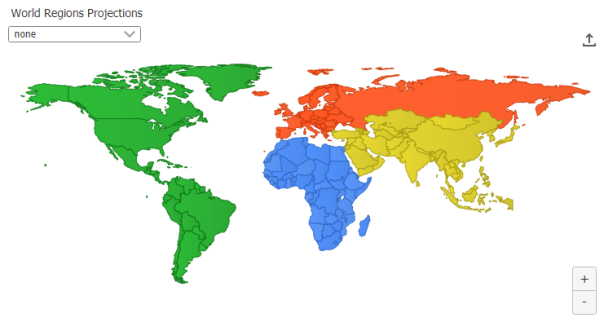
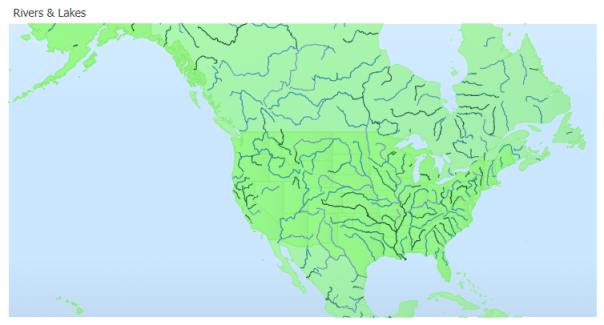
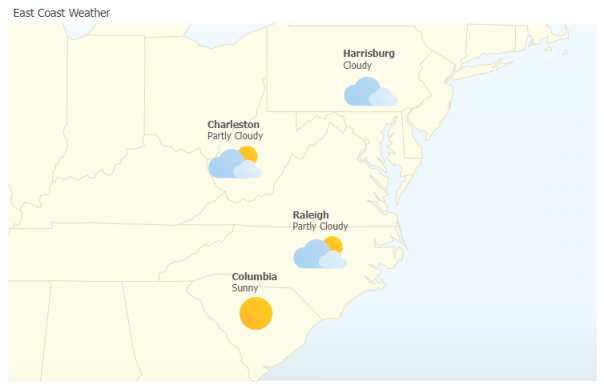
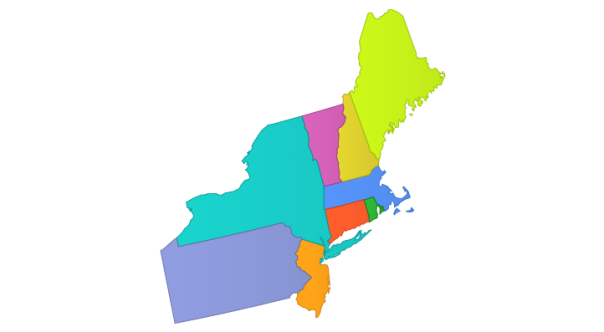
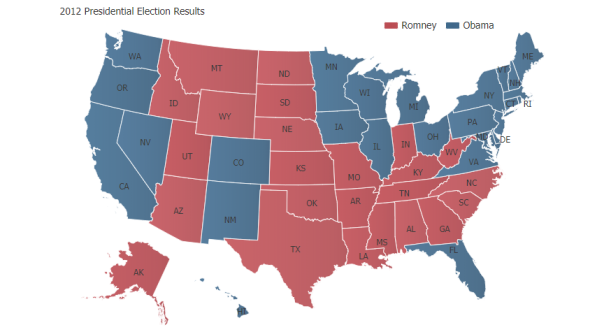
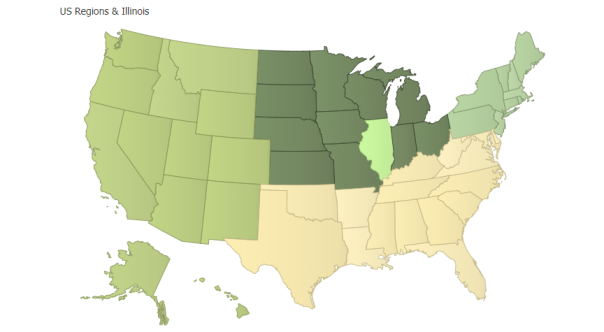
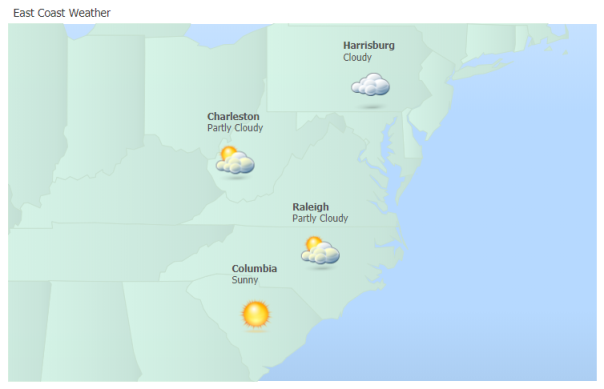
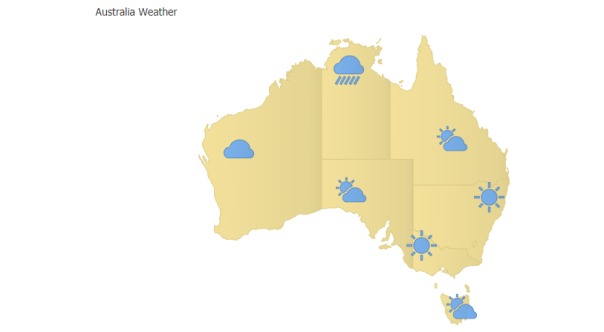
JavaScript mapping plugin for data visualization of your own data sets including heatmap charts, choropleth map charts and additional map overlay chart types for bar charts, pie charts and interactive maps all included standard with the JavaScript charting library. The JS Mapping JavaScript library also includes zooming, panning, projection support, custom tooltips, custom SVG maps with native JavaScript and HTML5 support. Complete world maps, state maps and province map visualizations include real-time animation, point series charts from GEOJSON, image export from the integrated server-side export system all make JS Mapping a popular JavaScript mapping data visualization library.
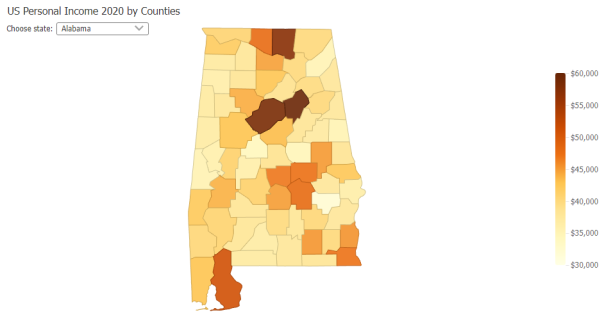
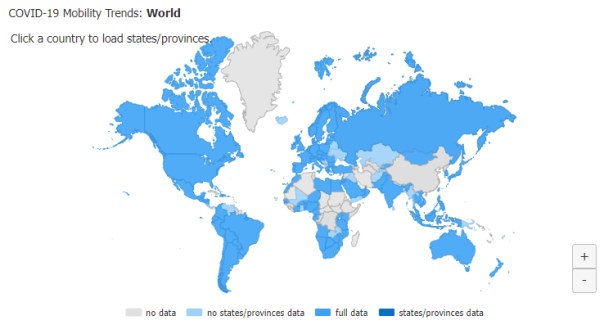
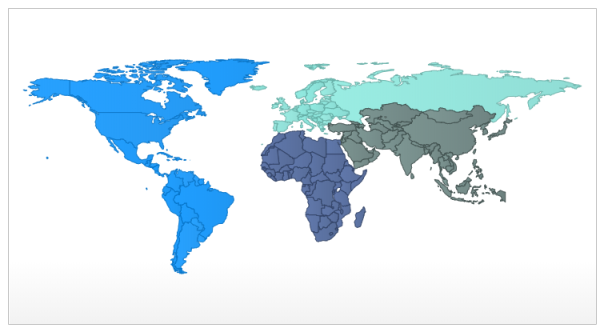
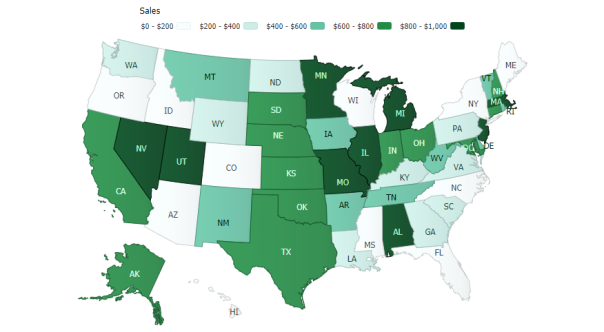
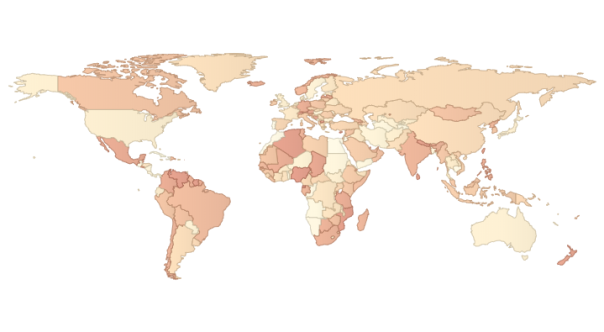
Choropleth Smart Palette
Interactive choropleth map of the world showing access to clean water by country.
Edit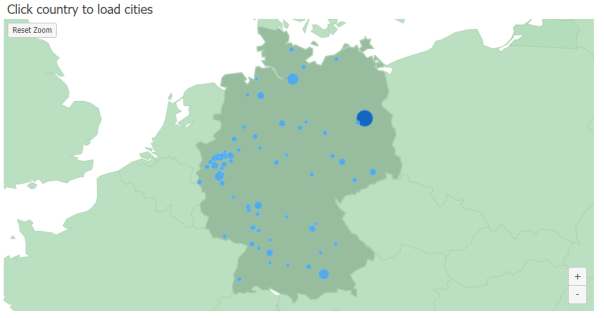

See also Mapping Chart Features Gallery