Slope Graph Charts
JavaScript Chart Types
Slope Graph Charts
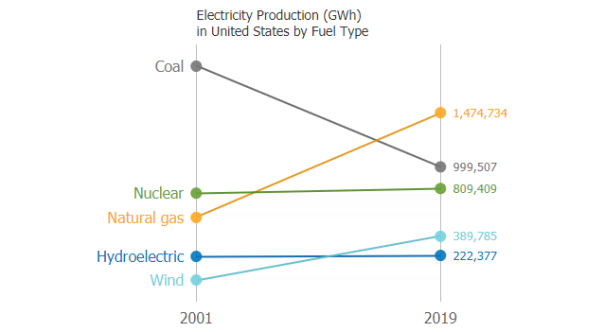
A slope chart is a simplified line chart that compares start and end point values. Slope graph charts are simple and compact data visualizations that enable you to view the change between points by the slope or steepness of the line between them.
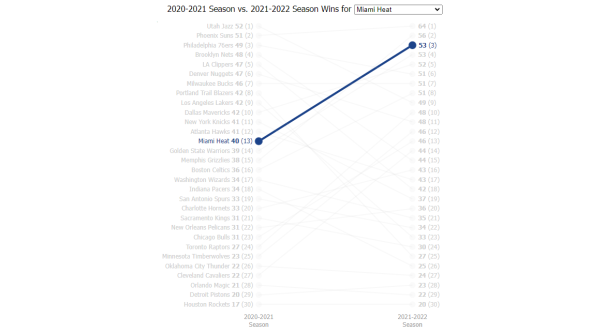
Slope chart that ranks items on both sides, uses 2-way dropdown selection, and first and last point labels.

Slope chart with two category scales using first and last point axis ticks on two Y axes.