Org chart support is included in each JSCharting JavaScript library license at no additional charge. The library automatically renders a resolution independent org chart SVG image from your own data (JSON, CSV, Database data all supported). Organization charts don't require any HTML5 or JavaScript knowledge and can be set with simple properties without needing jquery or other plugin dependencies. Org Charts may also be exported to PNG or other bitmap images from chart user interface. This feature uses a server side image converter that takes input SVG from the client side and outputs PNG, JPEG, or PDF (and of course the original SVG format). All modern browsers render SVG natively and legacy browsers such as internet explorer are also supported.

Organization chart data is arranged in a hierarchy with a root node at the top, feeding parent nodes, which are set first within the child nodes. Automatic layouts ensure your org chart looks great without collisions or overlaps. In addition, animation and dynamic direction orientations are supported through the toolbar with integrated events for left, right, down and up.
This example shows a family tree and you can see how the parent and child nodes and drawing linking connector lines with the automatic layout system.
Tooltips are also supported which enables you to create a visually clean org chart while also adding additional information, such as contact information or other metrics on the individuals in the organizational chart. Micro charts and sparkline charts can also be seamlessly integrated into tooltips for performance visualizations. This sub charts are also rendered natively and included with all licenses of the the JSCharting JS library.
Organizational charts render client-side, with layout algorithms automating the diagramming of the chart. A large sample diagram library shows how to use JSCharting org charts including source code that is easy to read and customize for your organization. You can download JSCharting JavaScript library and start building your own org charts today!
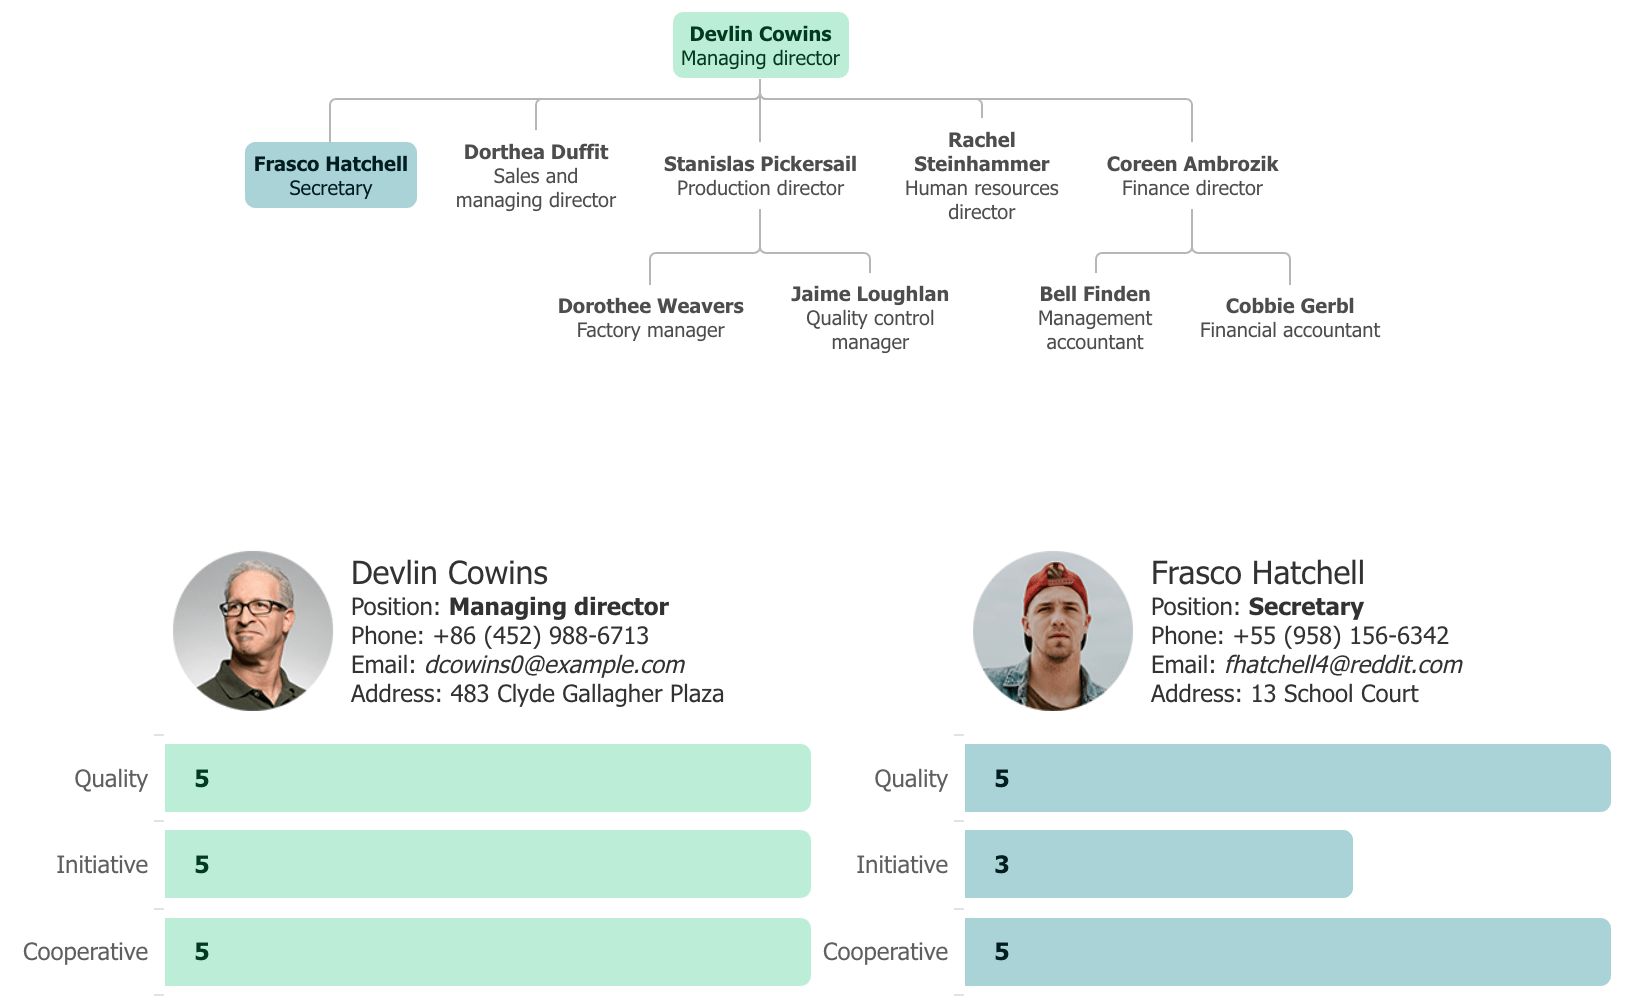
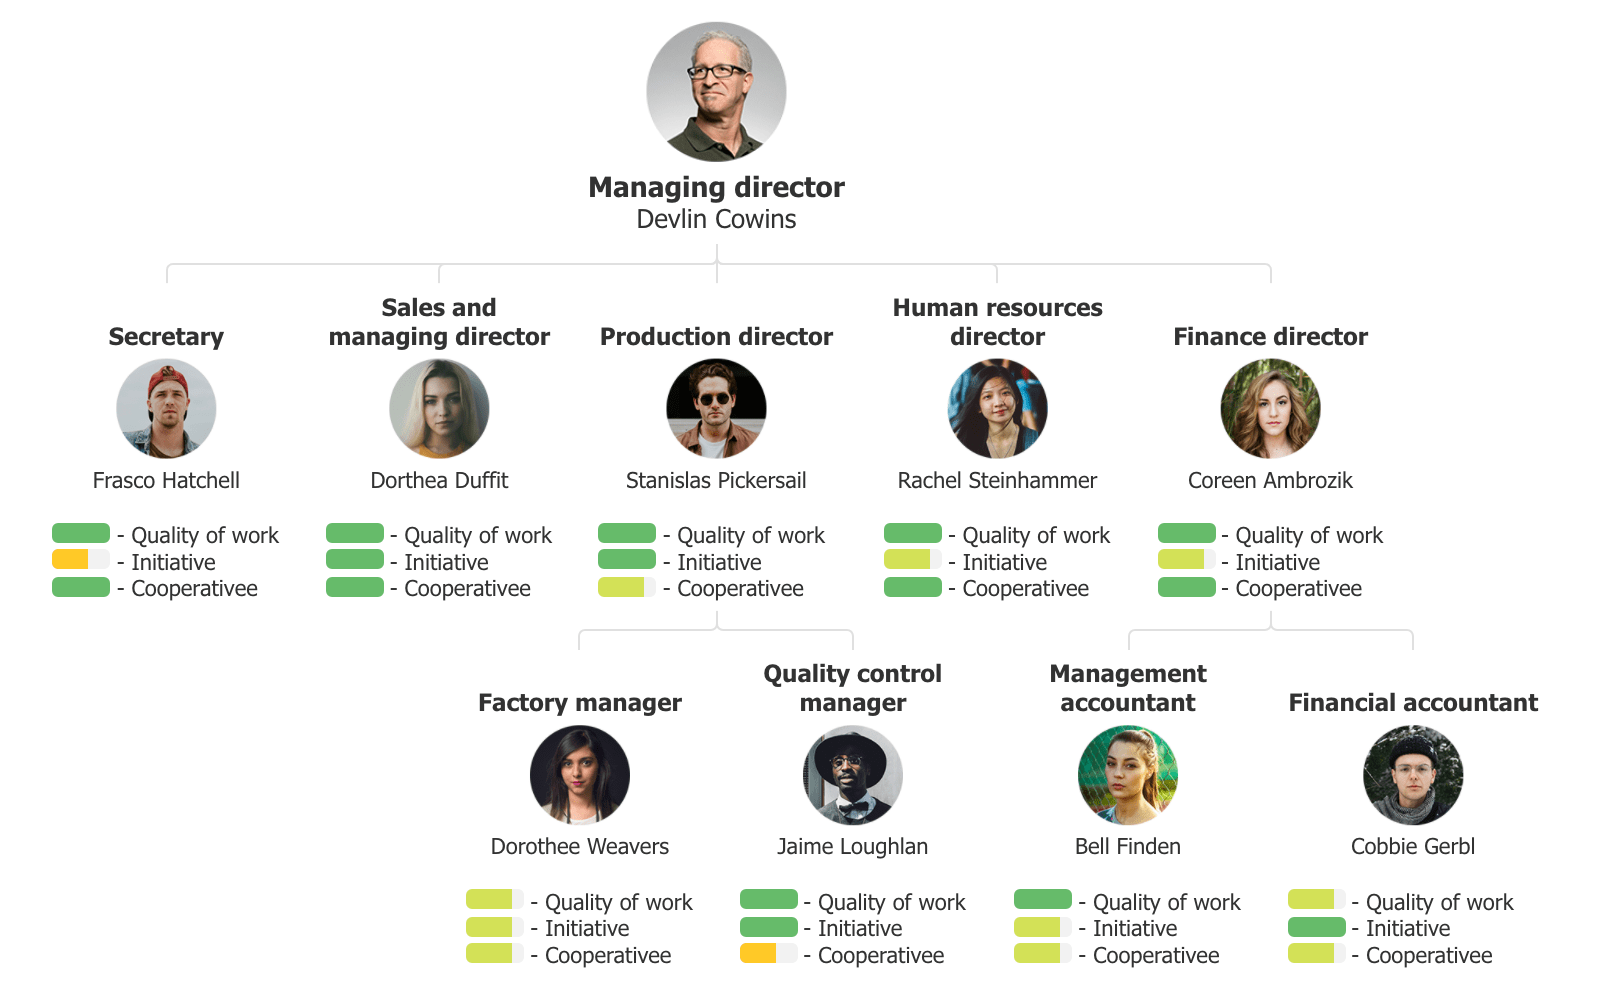
Org charts can be combined with linear gauges, bar charts and other chart widgets to create interactive animated comparisons. You can make Key Performance Indicators (KPI) organizational comparisons between employees by clicking organizational nodes within the org tree, while bars below show quality, initiative and cooperative scores. JSCharting animates transitions of both values and text seamlessly—try it for yourself by clicking two names in the org hierarchy above.

JSCharting org charts have been enhanced with organizational chart connector line styling including corner radius rounding. Now you can combine circular employee pictures with smoothly curved connectors creating a minimal and modern org chart in minutes. This example also demonstrates a multiple parent organizational chart placing the CEO in the middle.
View more samples in the JavaScript Organizational Type Gallery JS Org charts are now available as part of the JSCharting Bundle or Stand Alone as a dedicated data visualization library Download Trial or Purchase now.