Heatmap Charts
JavaScript Chart Types
Heatmap Charts
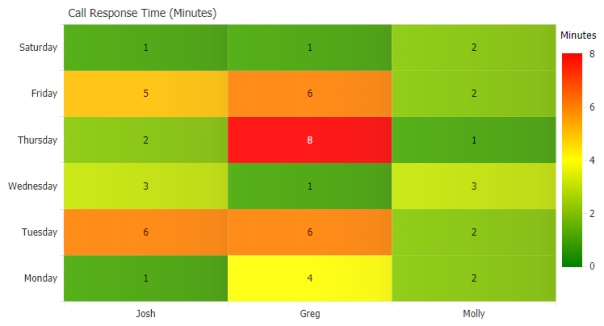
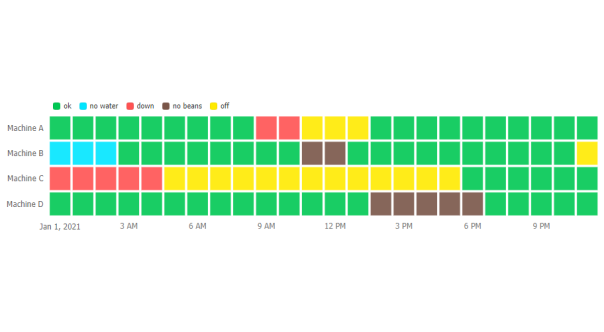
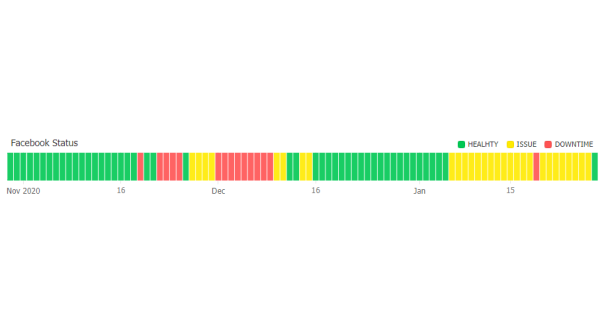
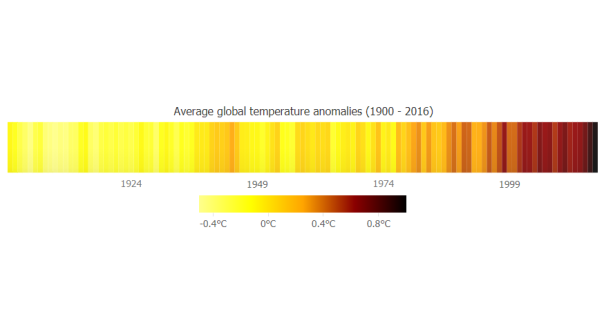
Heatmap charts show individual values based on a color coding to quickly enable identification of value grouping and outliers.

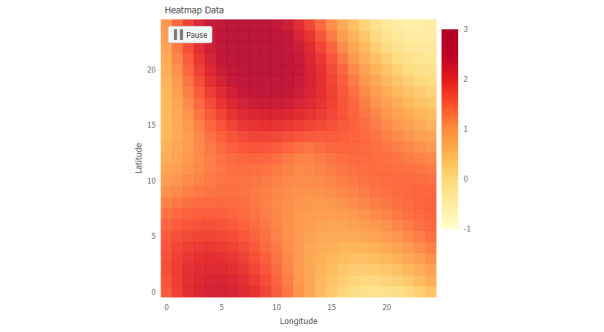

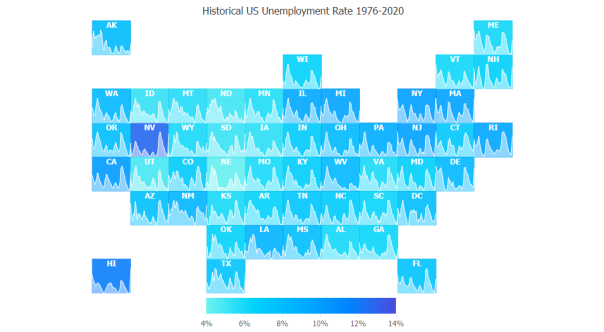
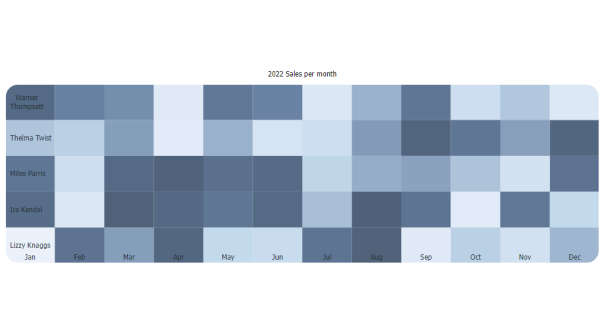
A full bleed heatmap chart that extends the chart area to the edges of the SVG image.
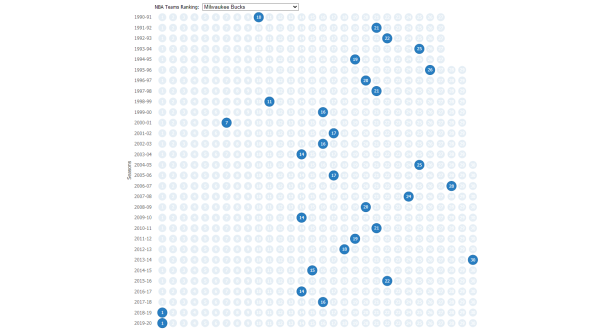
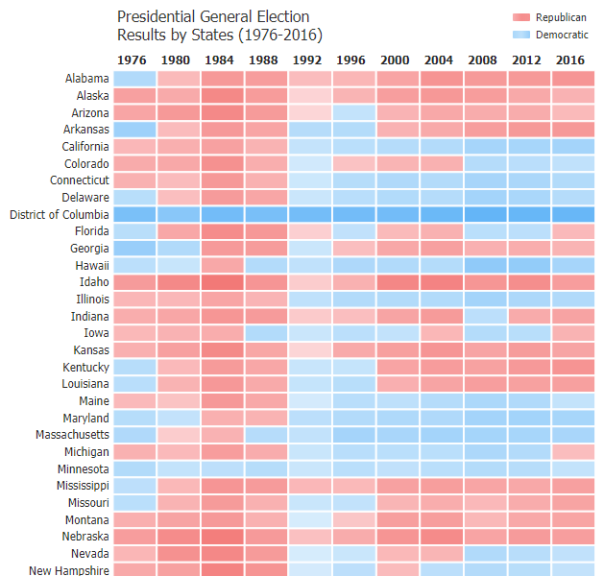
Interactive matrix diagram chart of NBA team ranking using series selection.

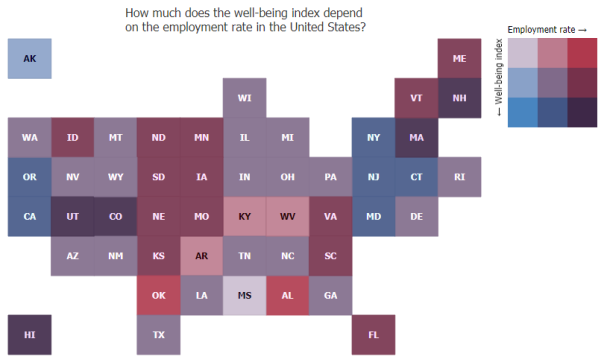
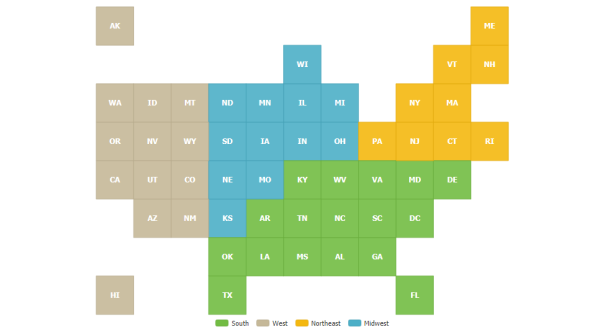
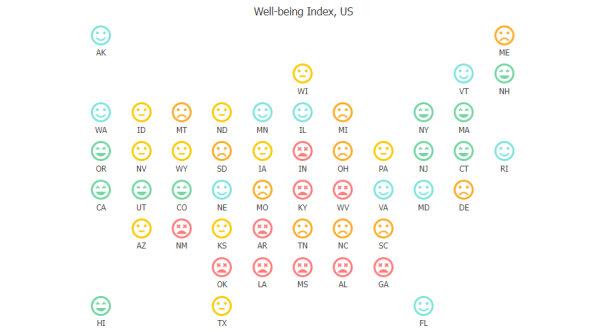
Tile map of US states for the 2020 election results with detailed tooltip information.
See also Treemap, Calendar Heatmap and Thematic Map Charts