JavaScript Chart Types
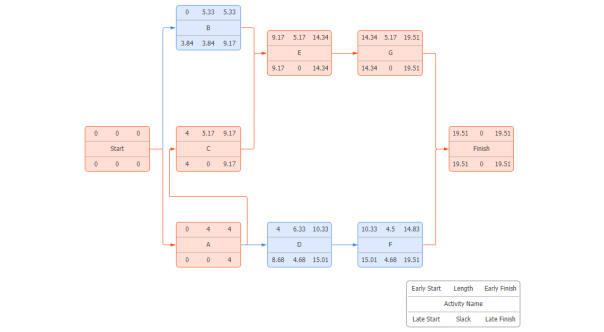
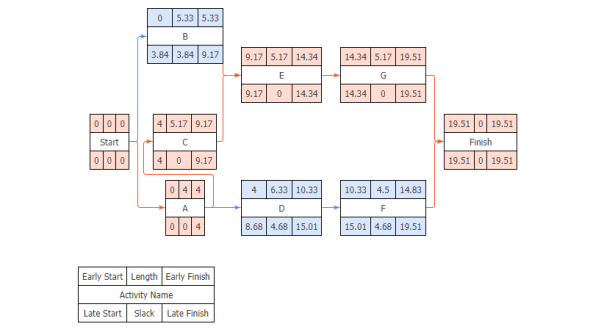
A PERT chart, also called a PERT diagram, is a project management data visualization for tasks in a project. PERT charts visualize a project's timeline using task dependencies, enabling project managers to analyze individual project tasks.