
Gantt Charts

JavaScript Chart Types
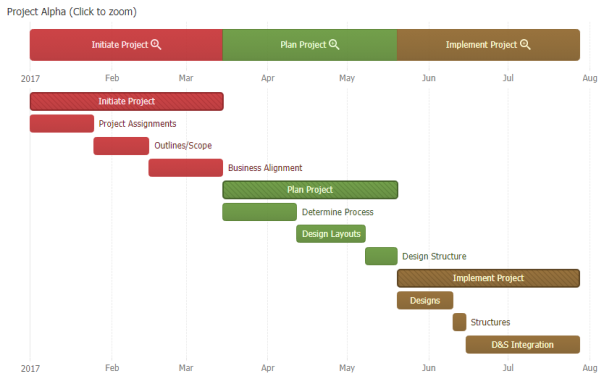
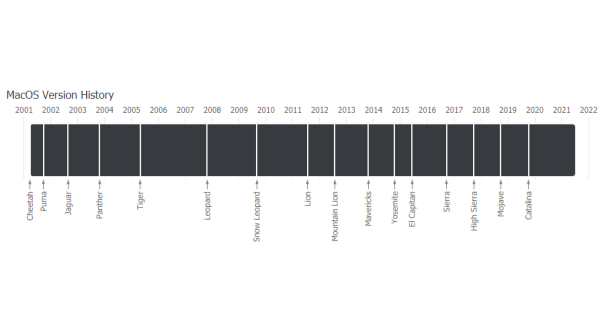
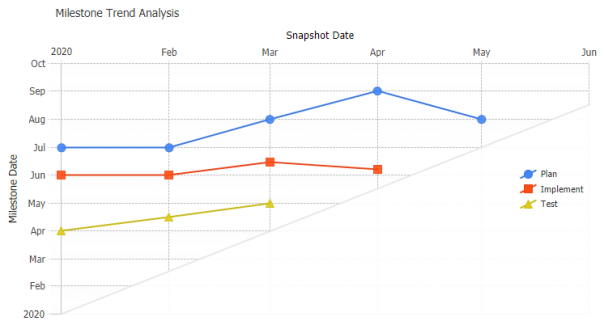
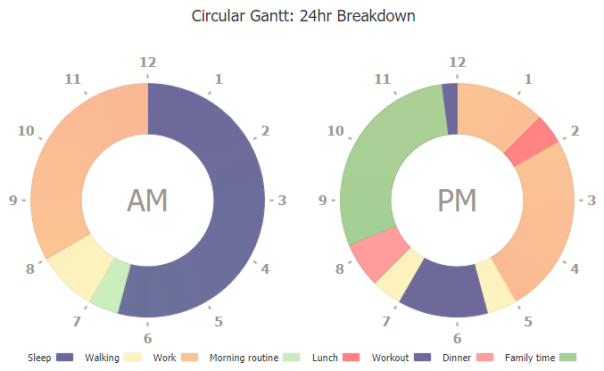
Gantt Charts

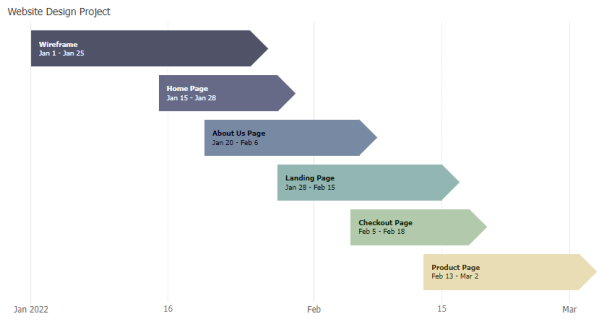
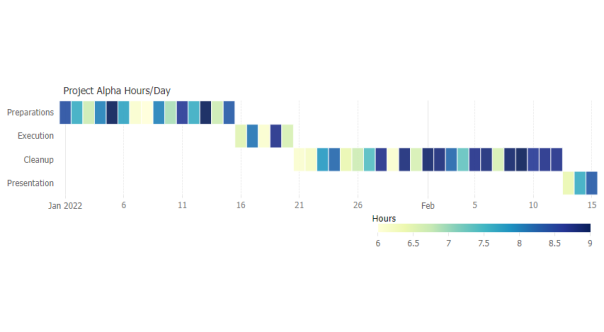
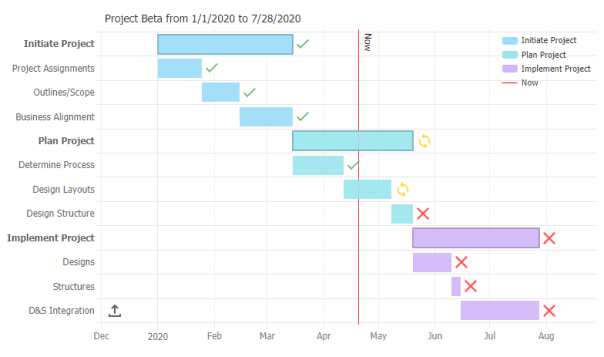
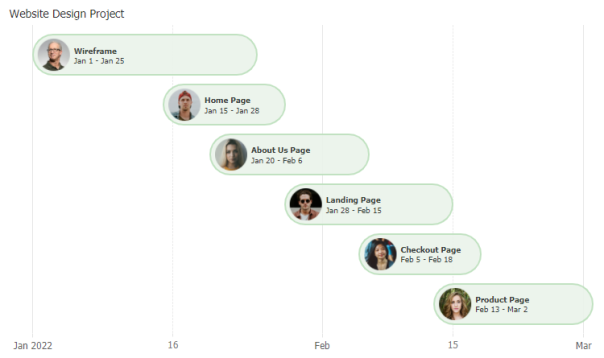
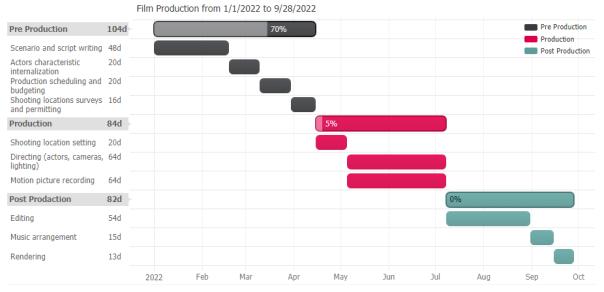
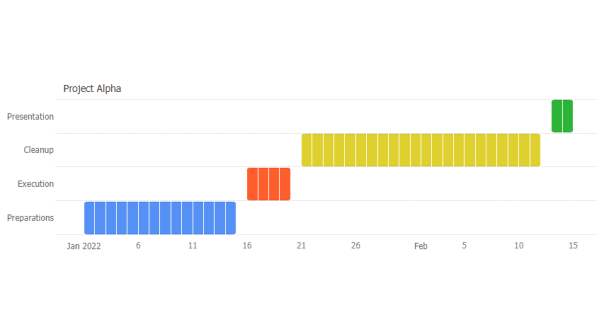
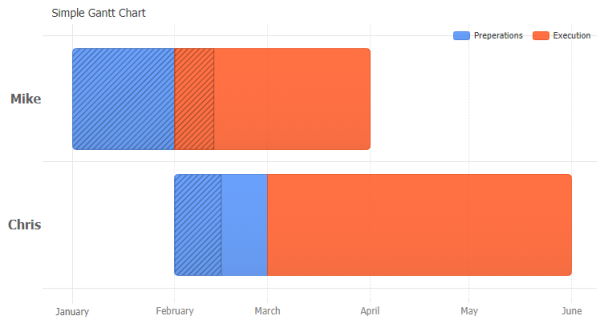
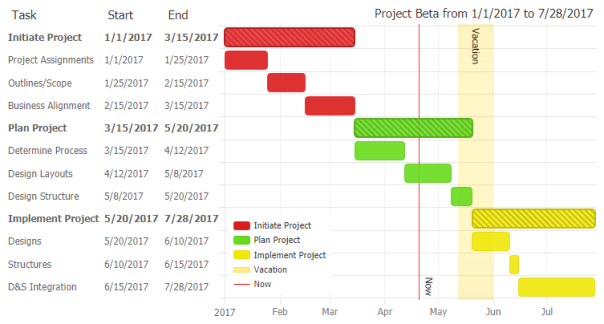
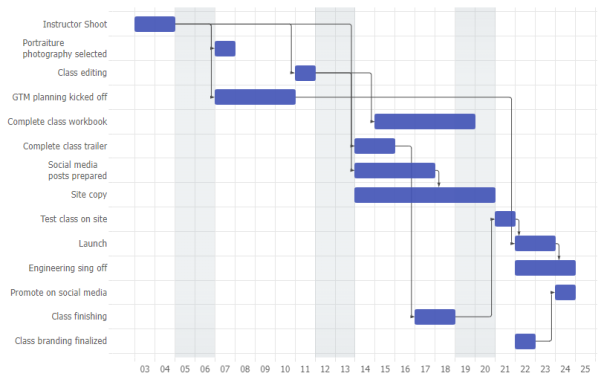
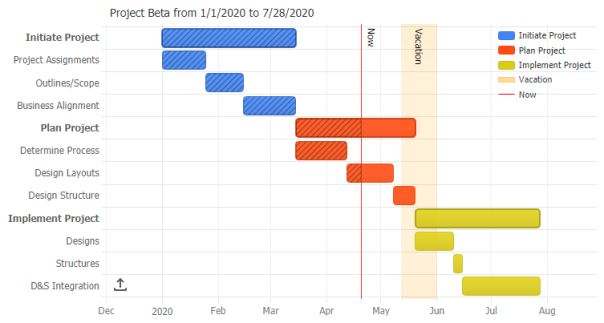
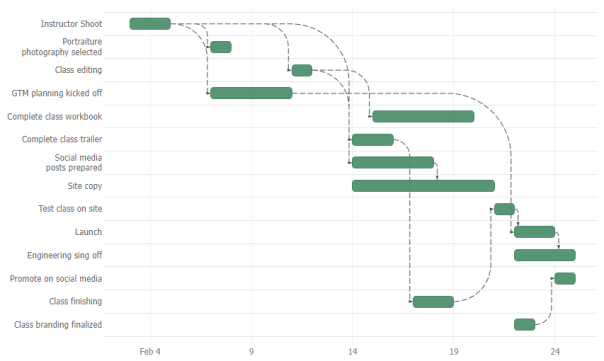
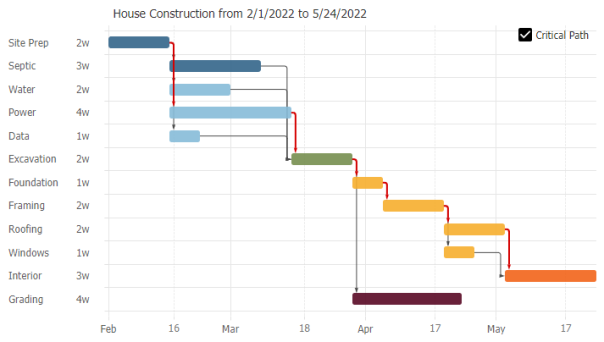
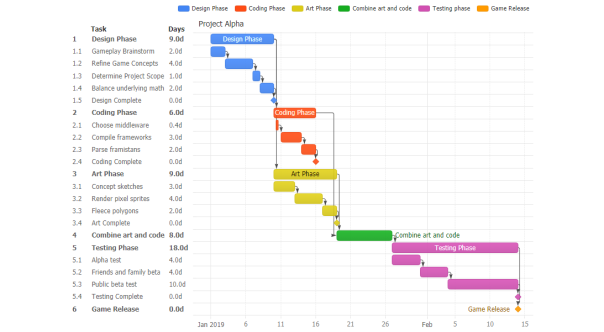
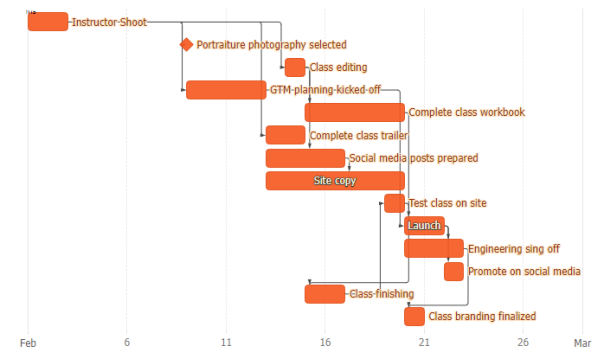
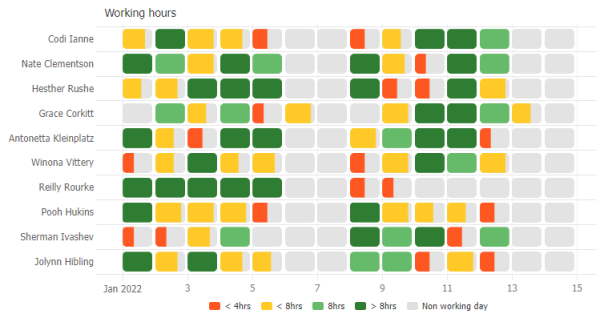
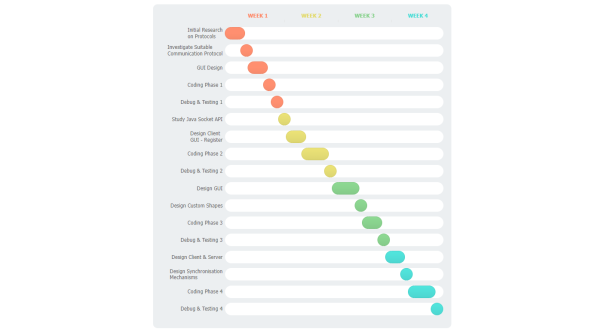
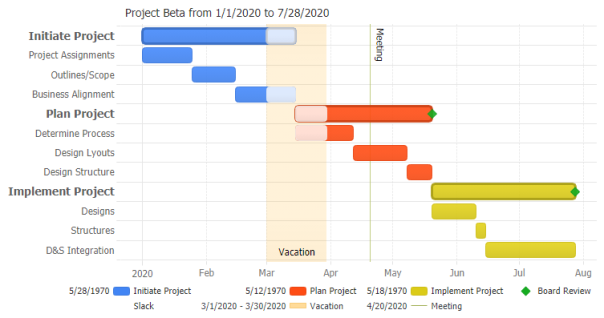
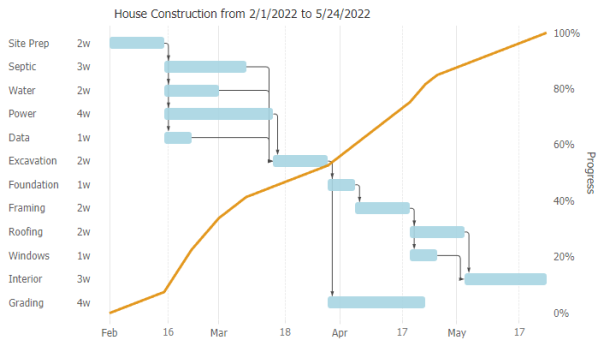
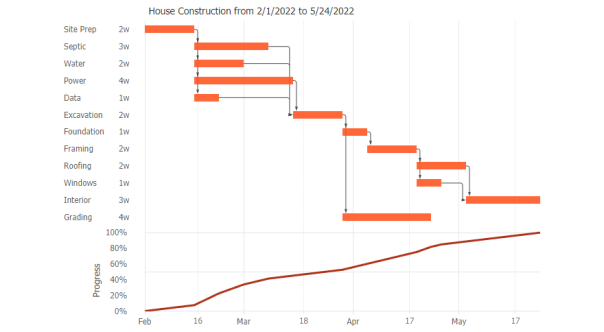
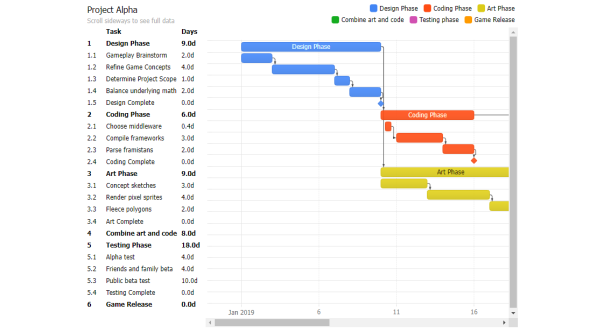
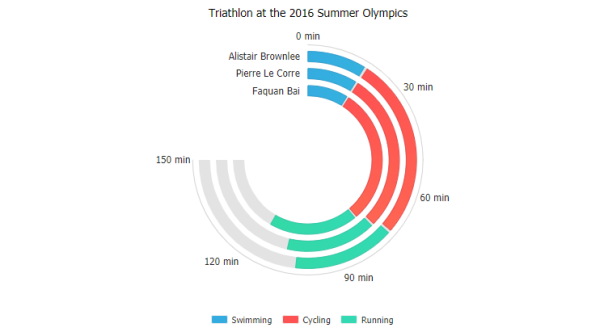
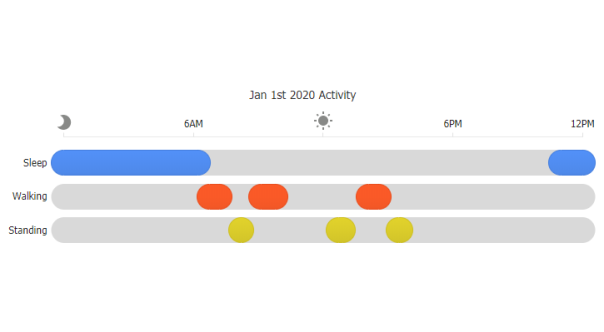
JavaScript Gantt charts offer project management and planning with tasks on the y-axis and time scale on the x-axis. The length of the task bars define the new task duration between the start date and end date. Tooltips show exact time period elapsed and support HTML and CSS formatting. Gantt chart data is easily loaded from JSON or your database and there are many high performance open source samples (including Angular, Vue, PHP and pure JavaScript) to get you up and running quickly without the need for custom styling or plugins. The Gantt component is rendered with SVG and HTML5 and fully cross browser compatible. Advanced Gantt chart component user interface elements include auto scheduling, Gantt dependencies, milestones, and grid label columns. JS Gantt charts are now available as part of the JSCharting Bundle or separately with the Gantt Chart Bundle Download or Purchase.

Axis Markers Gantt Chart

Gantt chart with axis markers.

Edit
Gantt chart with thin bars and dependency lines.
Uses point diamond markers on top of bars to simulate an arrow-like shape.
A Gantt heatmap chart encoding hours spent each day as a color.
Dynamically sets icons in gantt data point labels indicating task completion.
Uses labels with images of assigned person for each task.
Gantt chart with full rounded bars and column complete value without a hatch pattern.
Uses axis grid lines drawn on top of data points to segment Gantt bars into day parts.
Simple Gantt chart with % complete values.
Advanced Gantt chart with descriptive axis tick label columns.
A Gantt chart with weekend axis markers using calendar patterns.
Advanced Gantt chart percent complete.
Gantt chart with large dependency line radii and dash styling.
Toggle visibility of a critical dependency path highlighting.
Advanced Gantt chart with descriptive axis tick label columns and gantt dependencies for critical path analysis.
Gantt chart point labels using a dynamic label outline color.
Create a Gantt heatmap with points for each day using point.complete indicating the number of hours worked for that day.
Gantt chart created using linear bar gauge chart type.
Advanced Gantt chart with slack time, markers, and milestones.
Dynamically generate a progress line overlay for a Gantt chart.
Dynamically generate a progress line to use with a gantt chart on multiple Y axes of different types and orientations.
Gantt chart that uses HTML to create a scrollable chart area.
Gantt chart master detail Summary.
A gantt timeline chart with multiple axes.
Milestone trend analysis using dual time axes.
Circular gantt chart with a custom legend.
Nested circular gantt chart with a custom legend.
Gantt data on a linear gauge.