Donut Charts
JavaScript Chart Types
Donut Charts
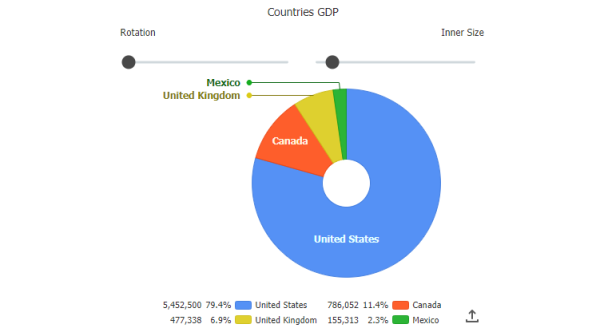
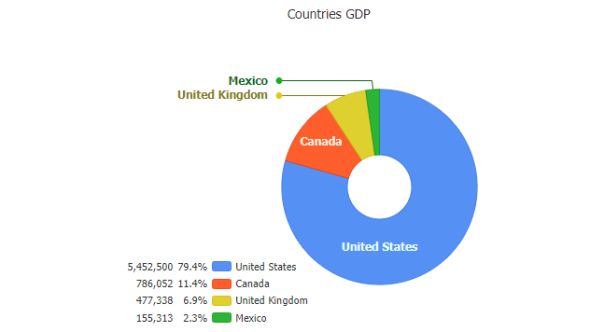
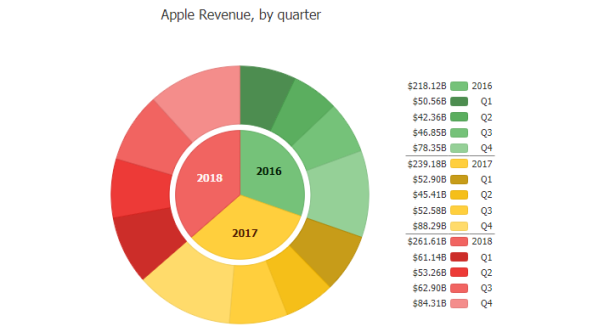
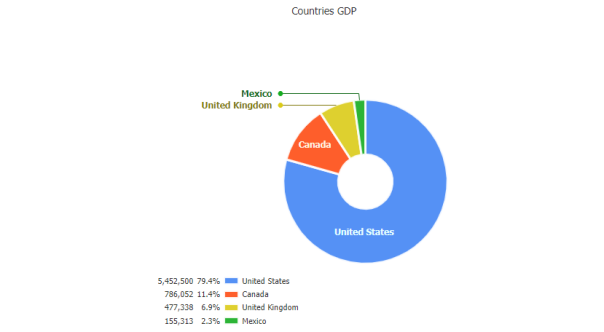
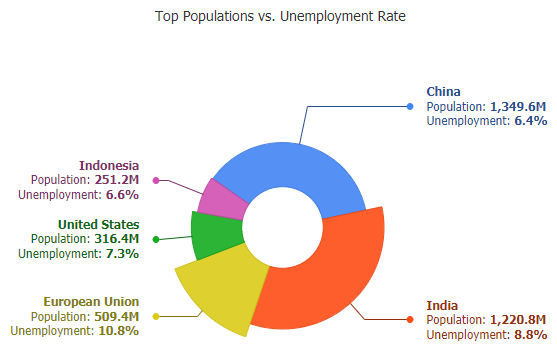
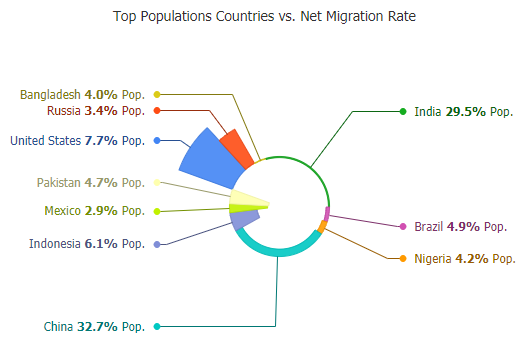
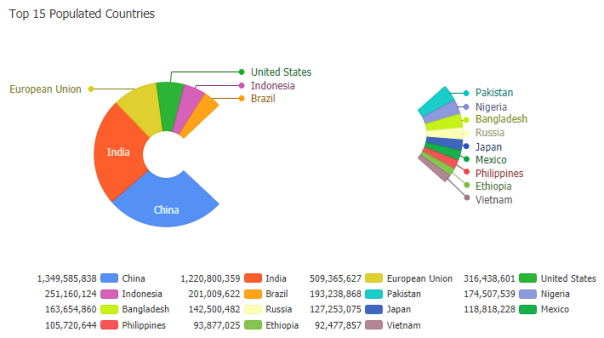
Donut charts offer proportional segmented values relative to the whole with a central cutout creating a lighter visualization. JSCharting supports advanced donut features including label callouts, tooltips and middle label support utilizing the internal donut space
Donut chart with only negative z values which control the slice lengths.
Donut chart with positive and negative z values which control the slice lengths.
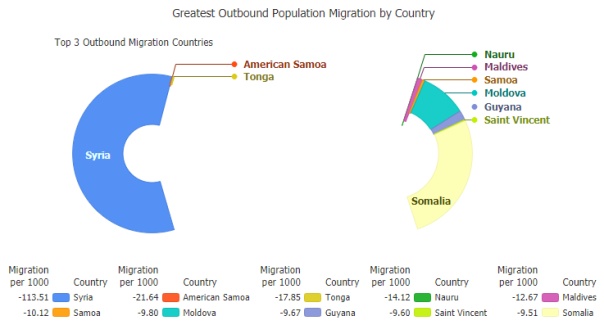
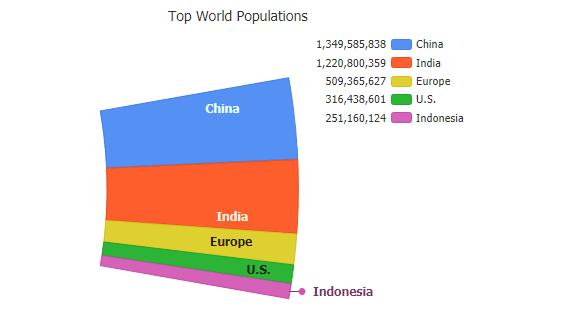
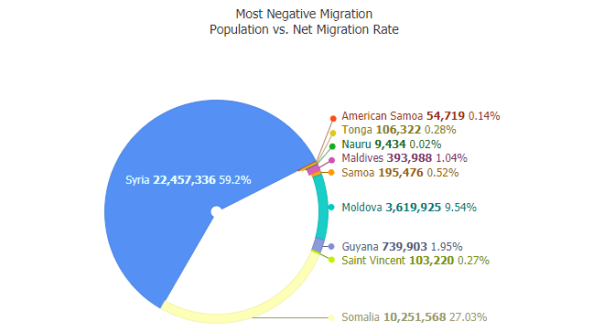
Donut series with arcs relative to each others sums and varying negative z values.
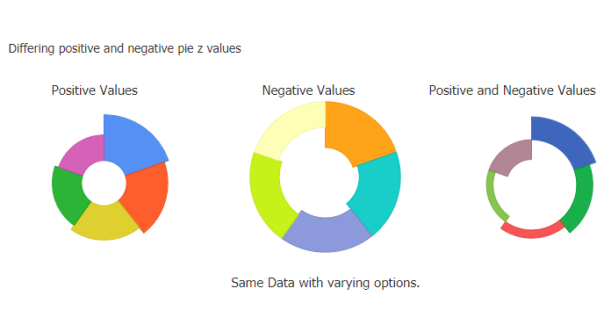
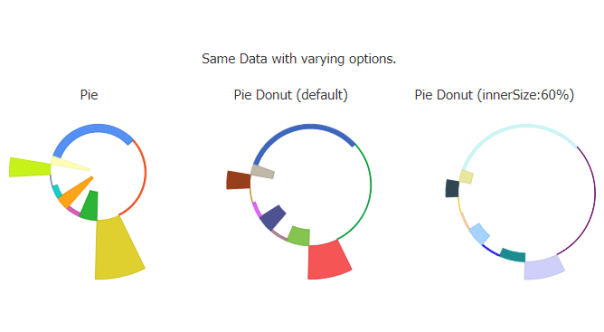
Positive and negative z values in pies of varying inner size.
See also Pie Chart Gallery