Visual Styling
JavaScript Chart Features
Visual Styling
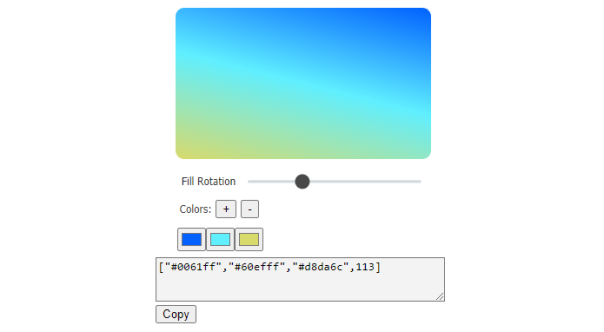
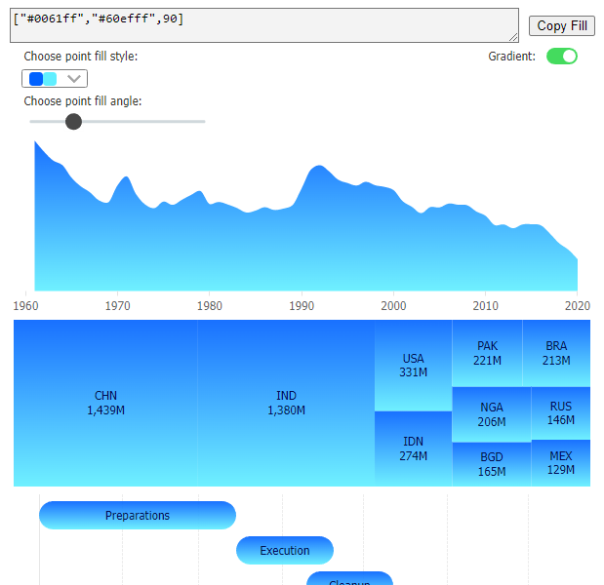
JSCharting is designed to look great without any tweaking or customization; however, it can also be customized to fit the specific look and feel of your site. Virtually all visual elements can be manipulated with advanced gradients and other effects to ensure your exacting needs are easily met.

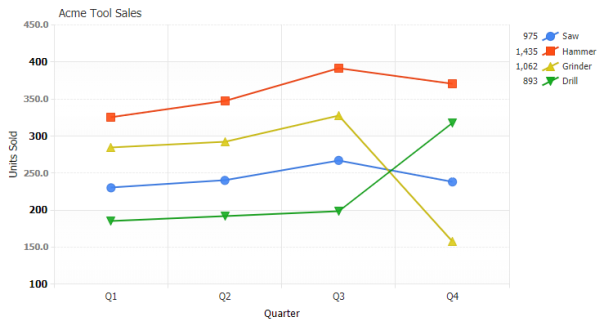
Uses the JSC.fontsReady() function to ensure 3rd party fonts are loaded before rendering the chart.
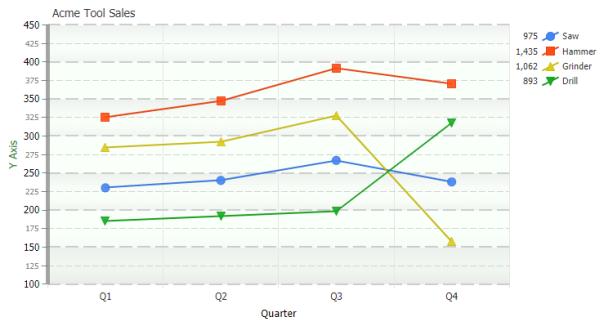
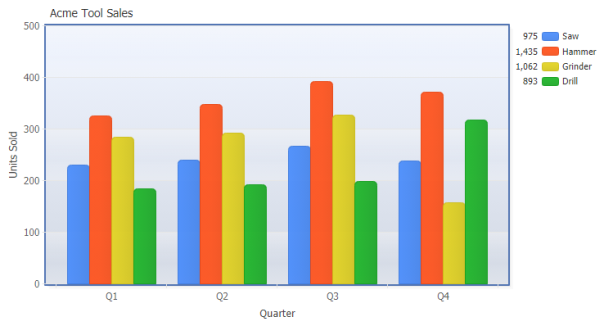
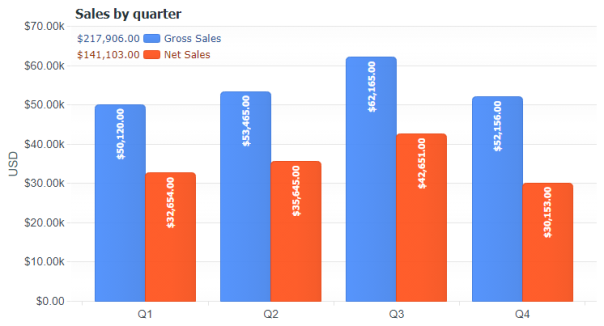
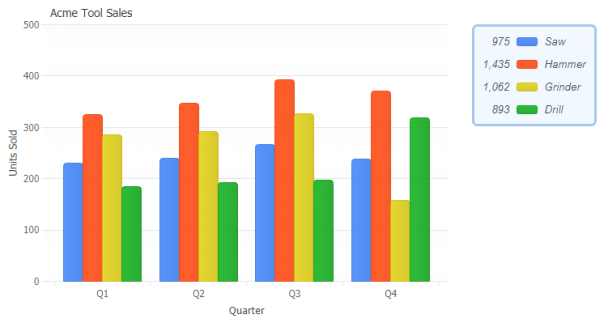
Demonstrates styling the y axis including all related elements such as gridlines, tick marks, alternate grid fills, and labels.
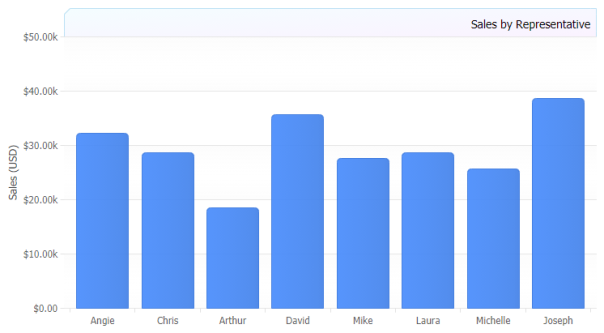
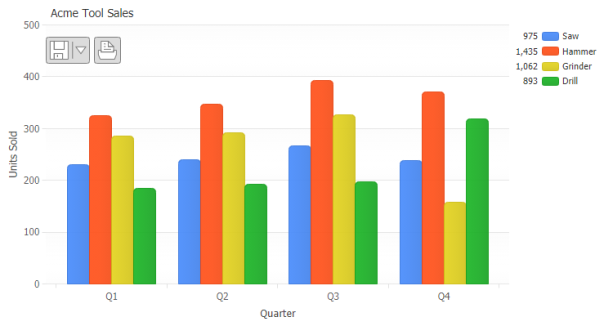
Utilizes a predefined template with a chart. A template can be used to define chart appearance for all charts in a website.
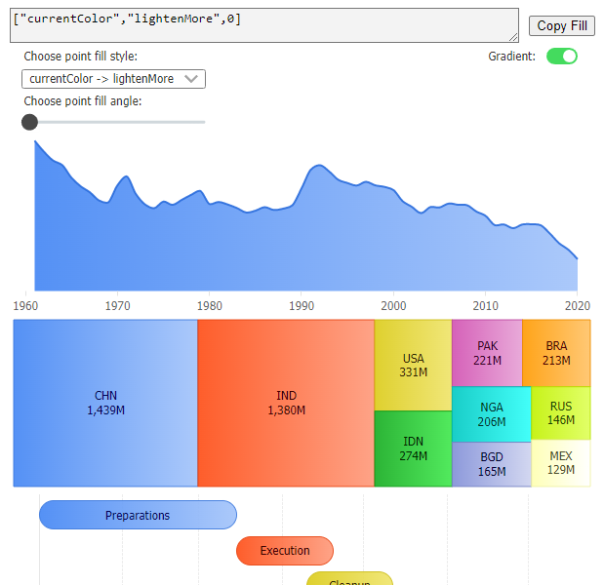
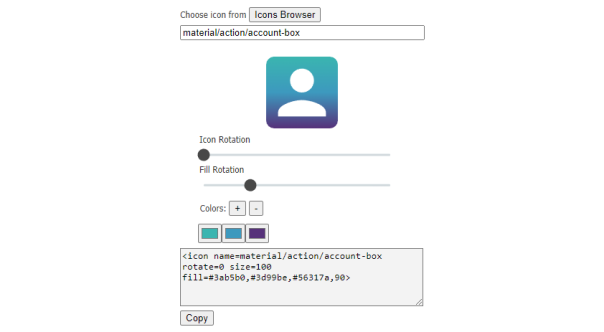
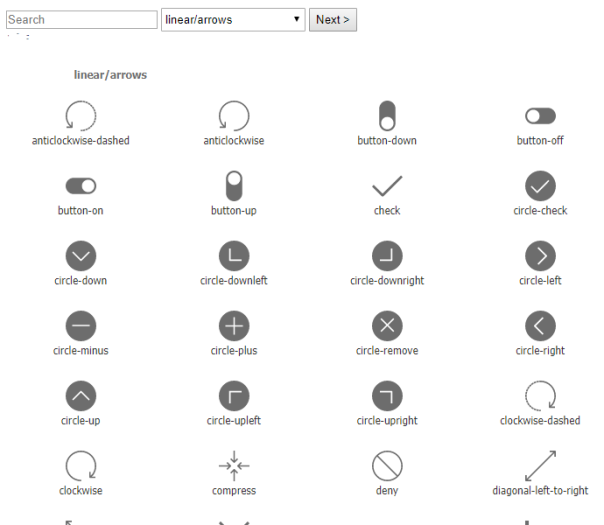
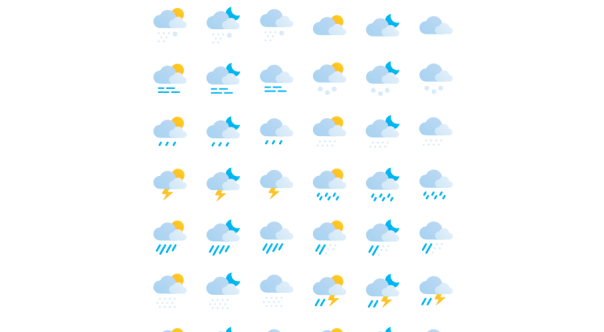
Weather SVG image picker UI for weather icons included with the bundle images.
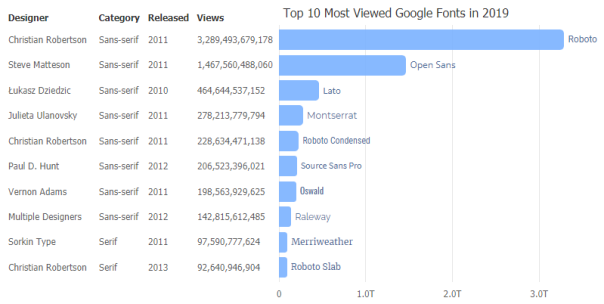
Shows usage of many different fonts within a chart using fontsReady to ensure the list of web fonts are loaded before rendering the chart.