Label
JavaScript Chart Features
Label
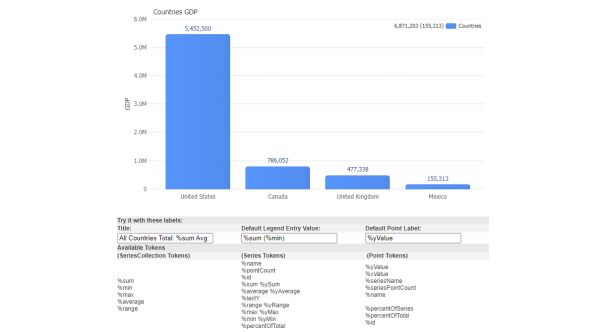
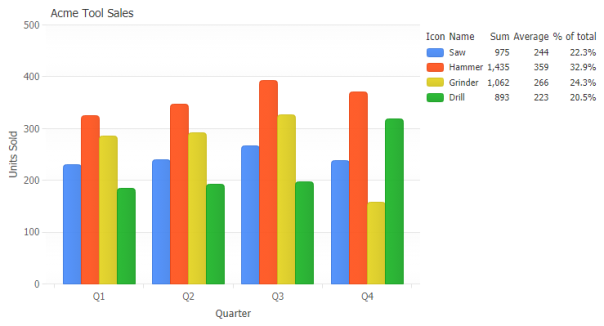
JSCharting includes advanced label support and functionality to quickly and easily render custom formatting and label options, even without the need of a callback function. Through a smart token system and inline formattting, JSCharting automatically displays data associated with the parent object saving development time and visualizing data values and related calculations with ease.
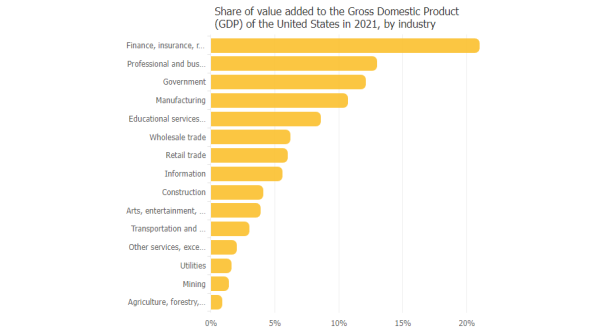
Limit label width and disable wrapping. Use overflow ellipsis to hide the excess text.

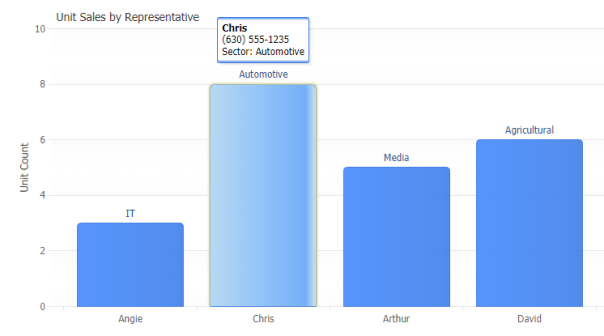
Shows 20 shape labels and their alignments set for a pie series. You can see how the labels align to the pie and directions they stack with labels sharing the same alignments.

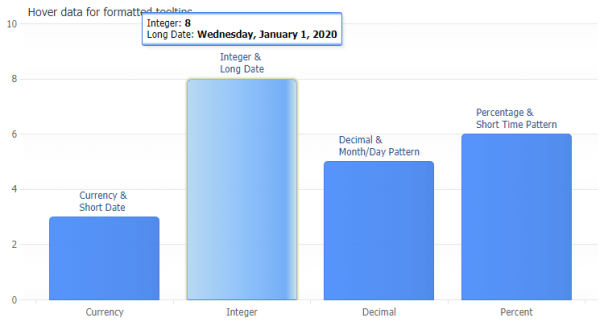


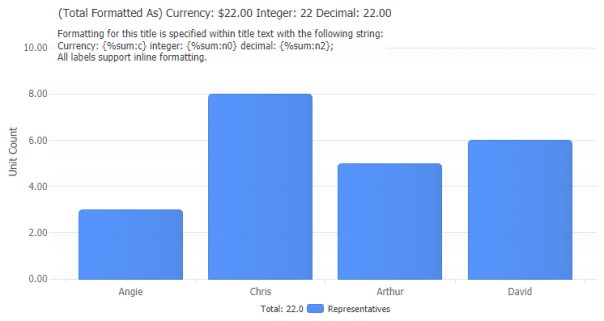
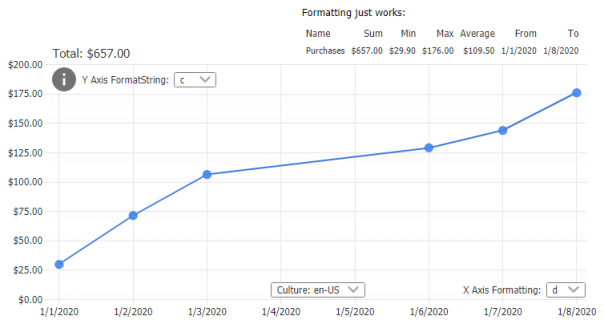
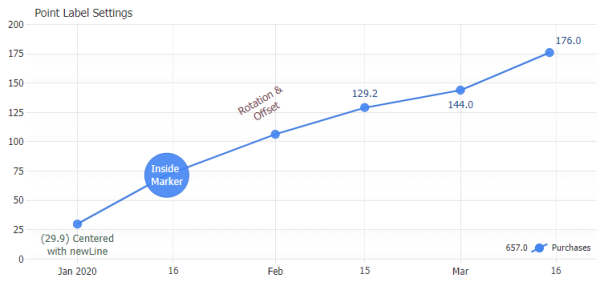
Uses inline formatting to show the same value but using a different format in the title.
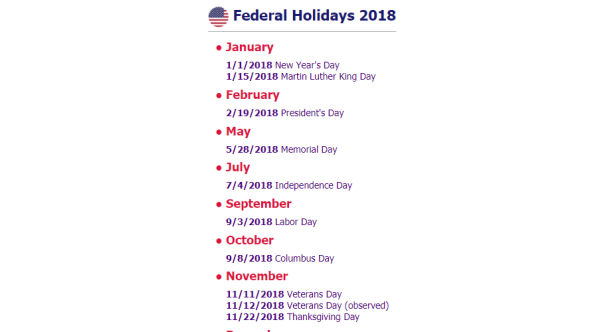
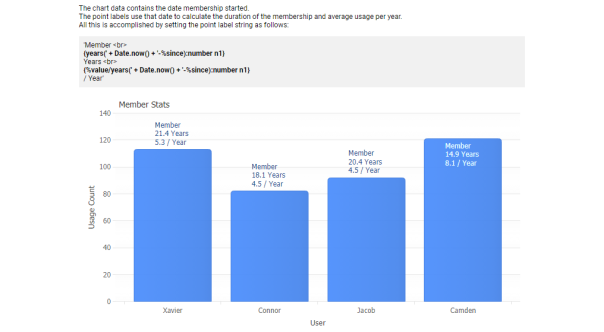
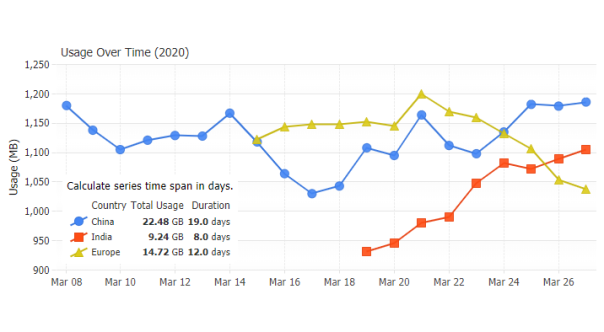
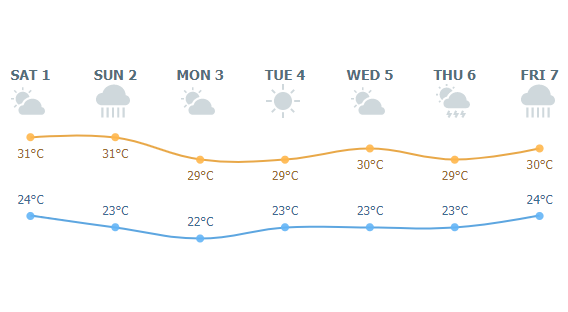
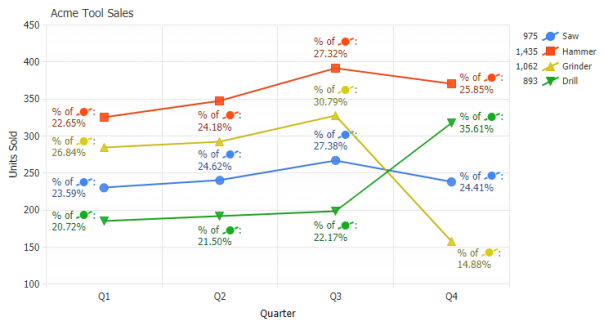
Demonstrates using token expressions to calculate time spans in days shown in legend.