Infographics
JavaScript Chart Features
Infographics
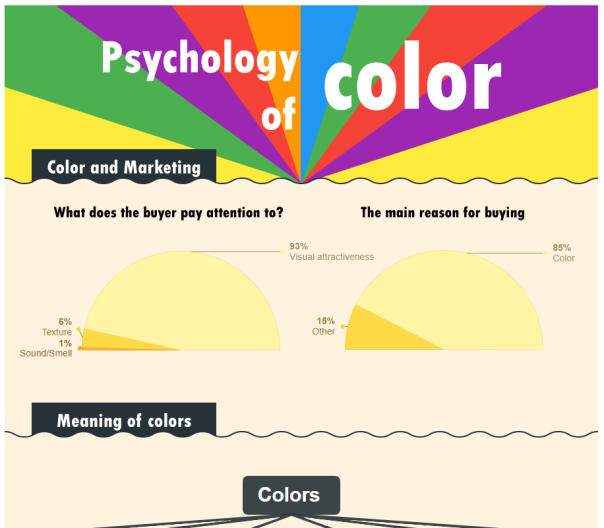
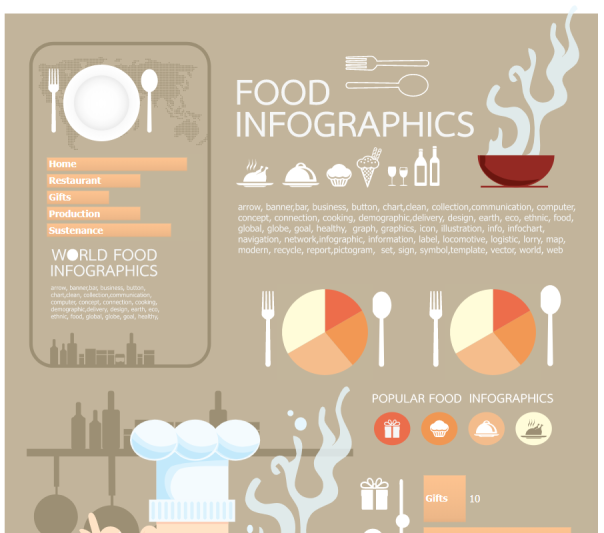
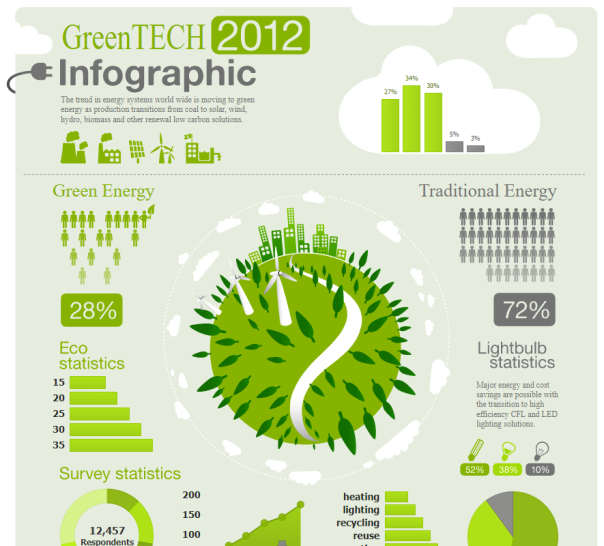
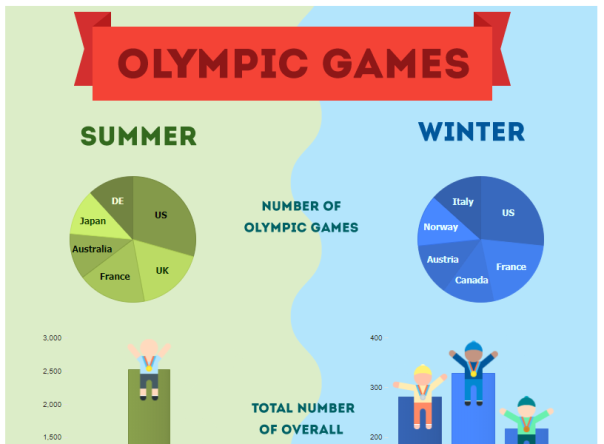
Create stunning infographics (information graphics) using JavaScript and HTML5 incorporating modern, attractive charts and data visualizations. Add JSON data driven charts with pure JavaScript and SVG. Simple web design via custom settings with HTML and CSS. Update chart snippets in real-time with a plugin free (not even jQuery) solution for creating interactive infographics for all modern browsers. Web developers can work with all JavaScript frameworks including angular, react, vue and more. Integrate our data visualization JavaScript library today using the open source examples below as a base for your own custom infographic web pages.


See also Dashboard Gallery