Axis
JavaScript Chart Features
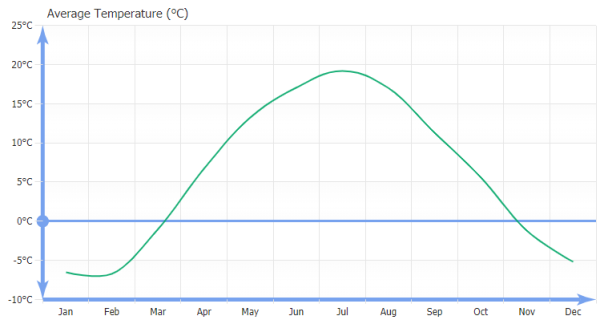
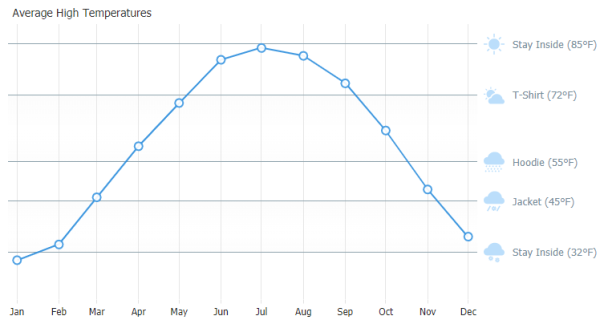
JSCharting has advanced axis support which automatically tunes, labels and animates axis transitions and scales. Axes may be duplicated and customized to show different units and complete support for multiple axis is standard. Customization and control is also offered for major and minor tick styling and interval settings. Advanced culture support ensures that your data displays correctly and is formatted correctly in different browsers, countries and cultures.

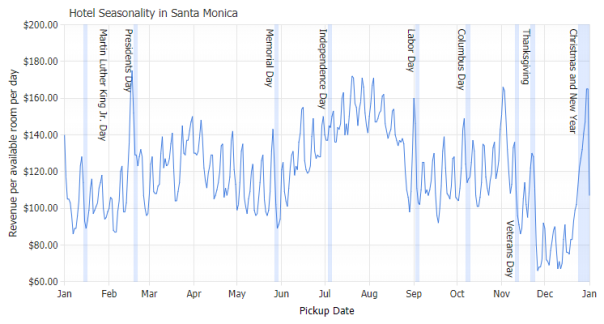
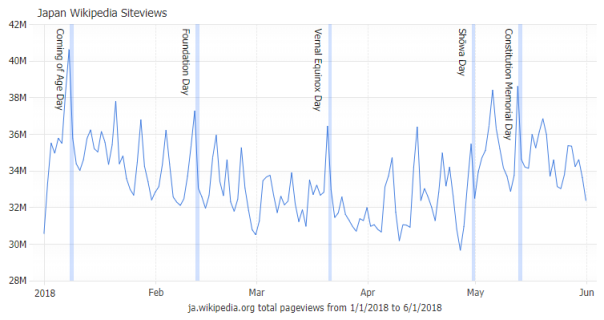
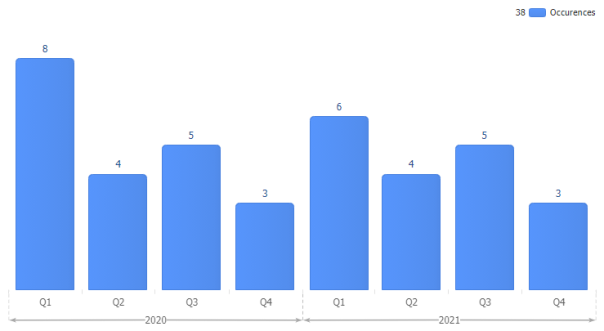
Holiday calendar pattern markers showing correlation with hotel traffic.
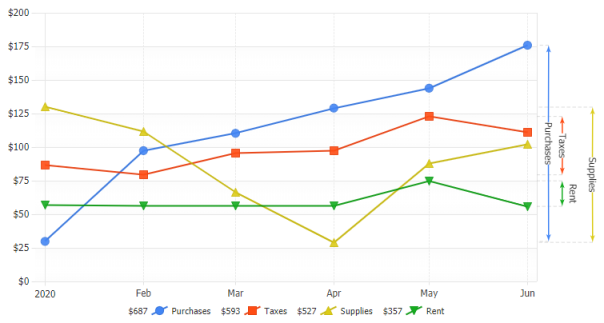
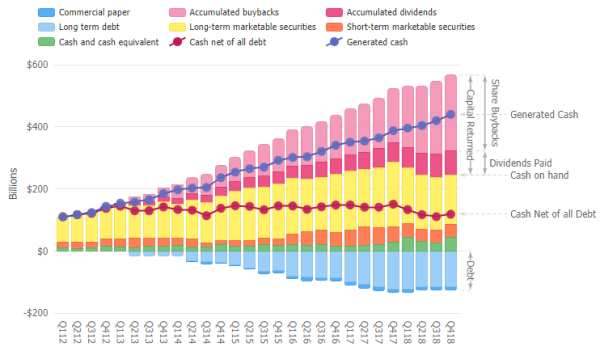
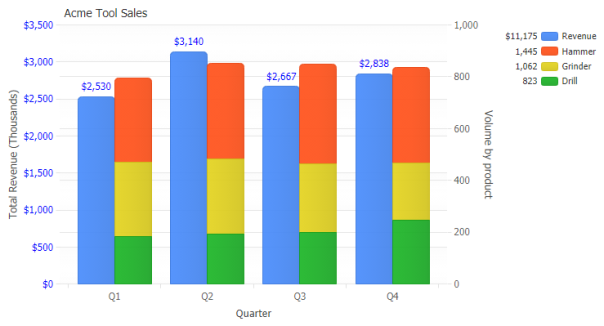
Defines multiple axes sharing common gridlines while using different units on each axis.
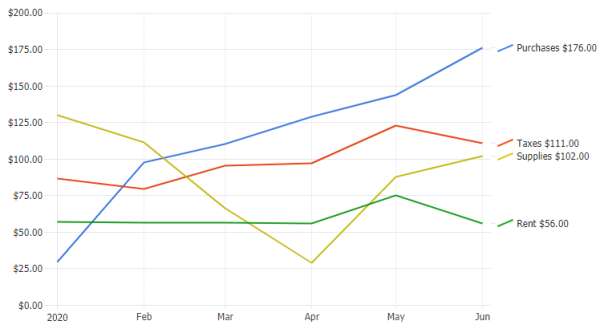

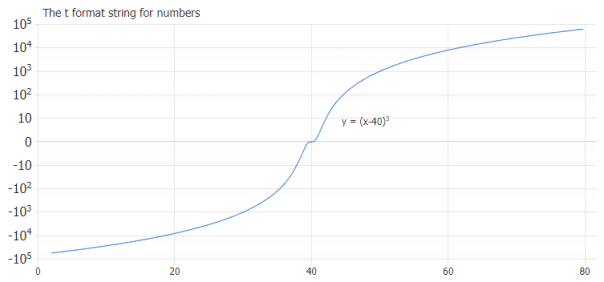
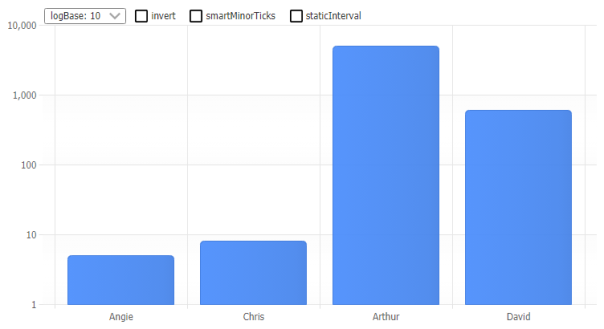
Negative and positive values on a logarithmic scale with t (ten) formatting.
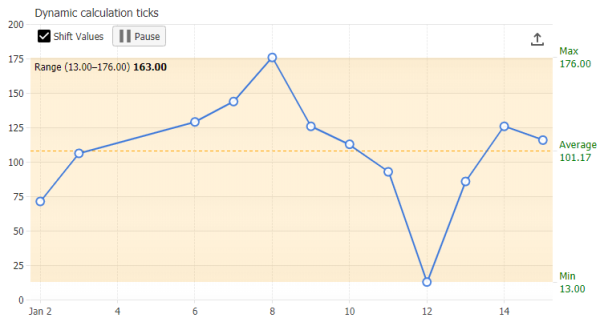
Dynamically updates chart data in real-time. Dynamic axis ticks display calculations that stay in sync.
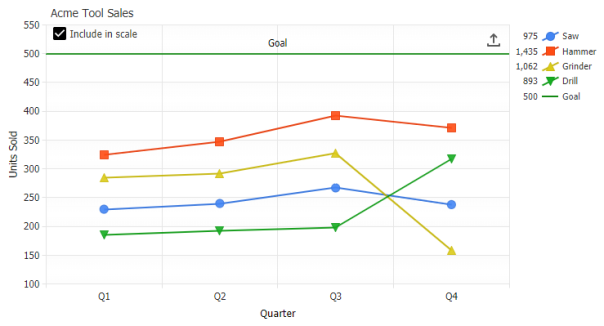
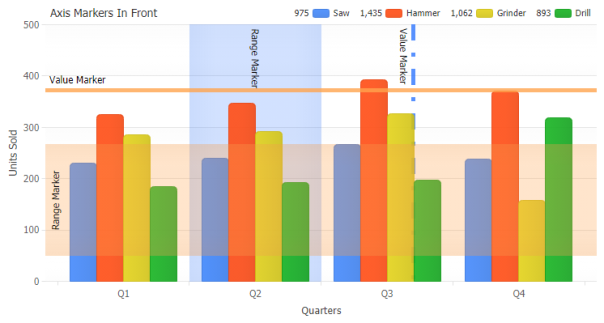

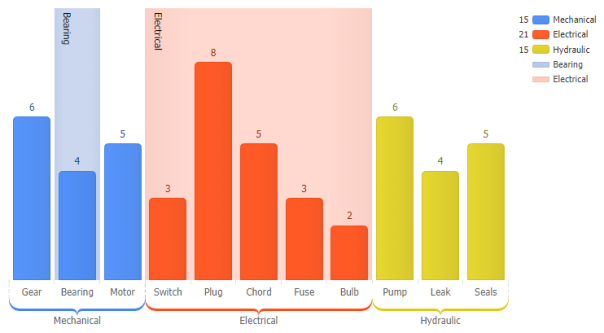
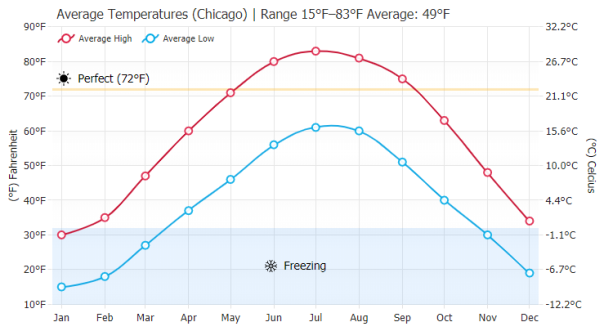
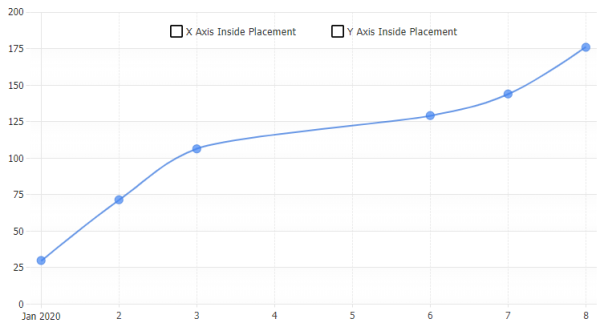
Custom axis tick with box fill options that is always visible by using the AxisTick.includeInScale option.

Use defaultHiddenTick to stagger tick labels by setting a pixel offset for ticks that are overlapped.
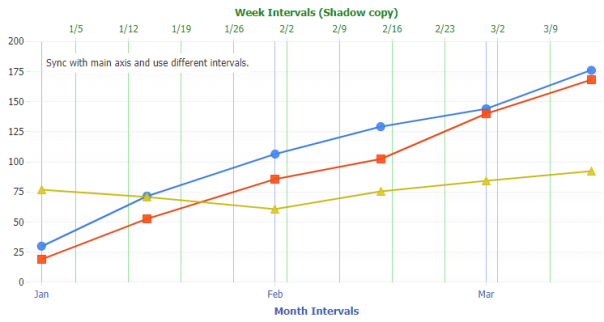
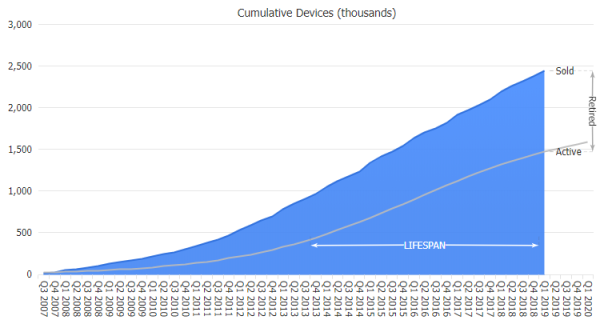
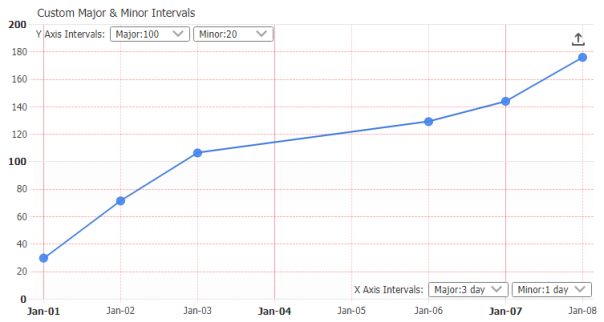
Define multiple axes sharing a common time scale while using different tick intervals.