JSCharting includes an incredibly extensive suite of 150+ advanced chart types, interactive stock charts and JSMapping all bundled at one low price. The team at JSC is totally committed to making the best visualization tools in the world and constantly innovates based on your feedback. Below you can find a selection of exciting new features powered by developers, for developers. Enjoy!
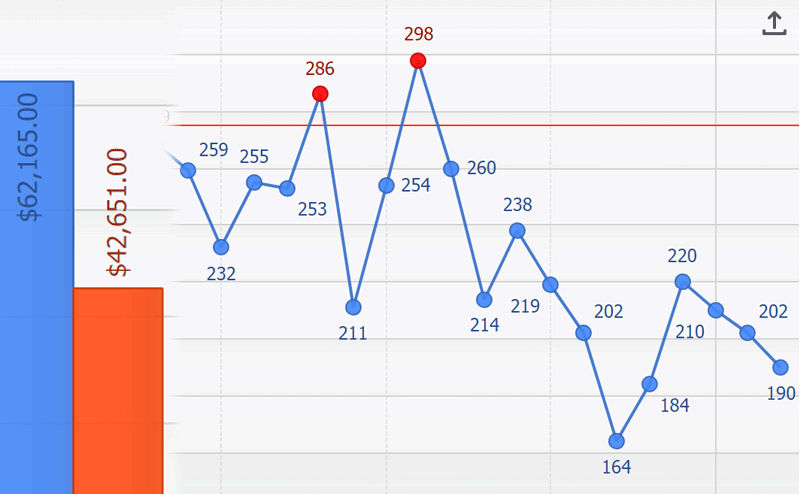
Data Point SmartLabels
JSCharting includes an intelligent point labeling system that is capable of handling label collisions and fit issues automatically without obscuring other points and labels.
Labels have smart layout logic enabled by default. There are four optional properties that can influence this behavior. They are align, verticalAlign, placement, and autoHide. By default, autoHide is true and the other 3 properties are in automatic mode. The smart layout logic will compute suitable options for these properties when they are in auto mode. Any or all of these properties can be set and the chart will still intelligently select the best options for the remaining properties that are in auto mode.
Vector Icon support through the <icon> text tag
The icon tag can now be added to any text label with the full JSC library of icons available.
Icon BrowserIn addition, icon tags support using SVG paths directly in label text. Icon width and height settings are automatically scaled so the path coordinates are seamlessly handled when using this feature.
Text customization enhancements
All text labels now support additional html tags such as
- <hr>
- <ul><li> with nesting
- <img>
Box layout system
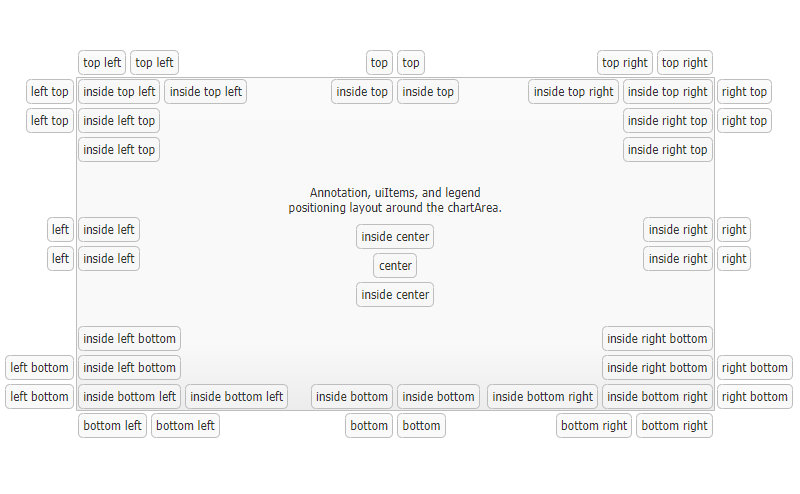
JSC Version 2.6 introduces a major enhancement to the box layout and positioning system, unifying the legend, annotations, and uiItems into a single layout mechanism with positioning options that arrange the boxes either inside or outside chart area. The syntax of the position properties are as follows:[ placement ] [ first (dock to) alignment ] [ second alignment ]
- Placement is an optional prefix that can be set to 'inside'. If not provided, 'outside' is used by default and places the box outside the chart area.
- First Alignment indicates the side of the chart area the box will dock to.
- Second Alignment is also optional and defines the alignment of the box on the side it is docked with.
Image exporter file attributes
The image file exporter now supports custom file attributes such as PDF author, subject, and other meta data.
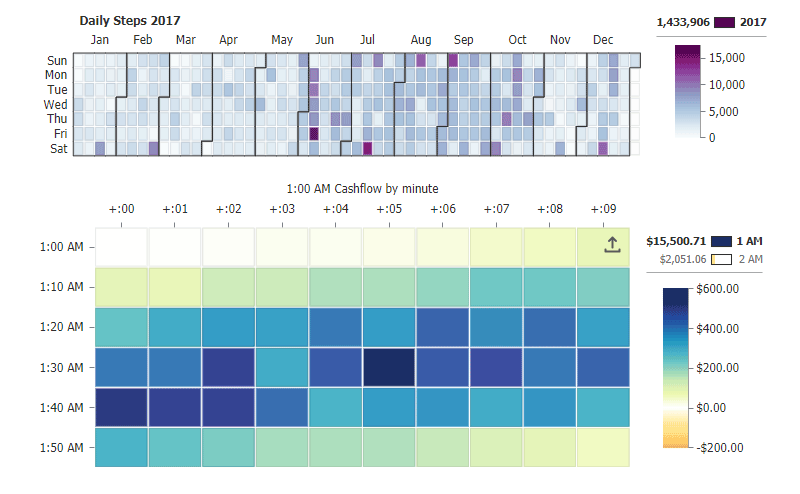
Calendar heatmap chart type
A powerful and dynamic calendar chart type has been added in v2.6. It includes many time based views including year, month, second, and everything in between. Date value data pairs populate the calendar with Heatmap data which can be rendered seamlessly.
See the calendar tutorial for more information or view examples in the calendar gallery section.
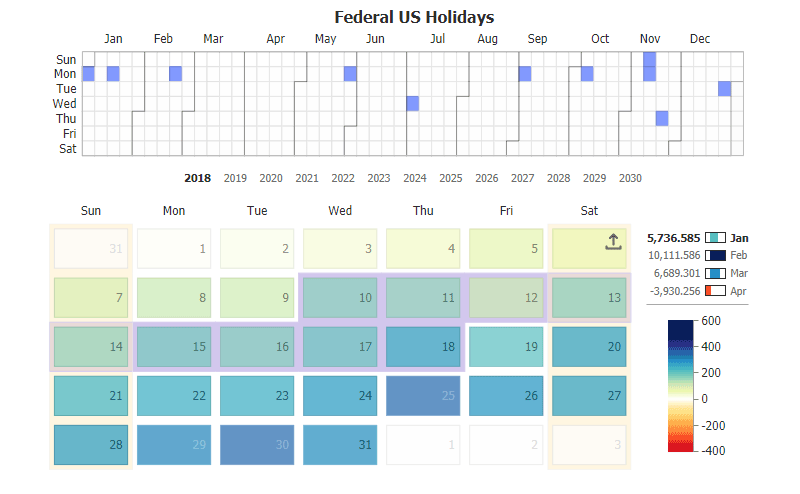
Calendar Patterns
Calendar patterns provide a powerful api to communicate date time specific filters and intervals to bind styling options to calendar cells and define calendar highlights. See the calendar patterns tutorial for more information.
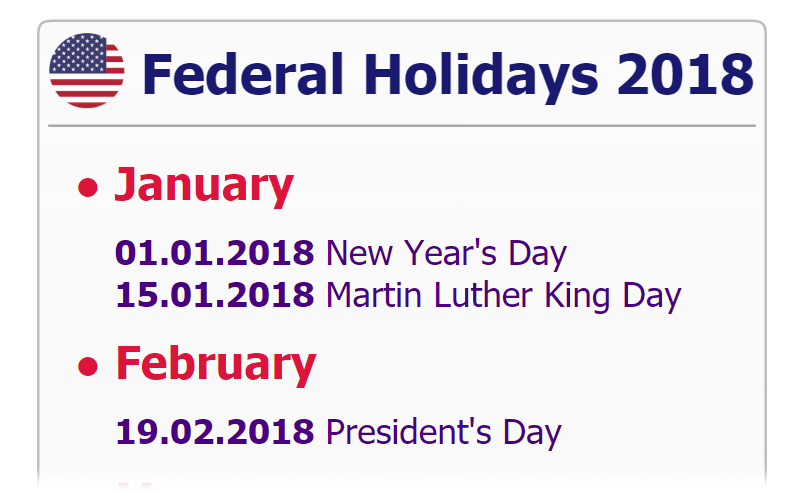
CalendarHolidays – This sample uses calendar patterns to define US federal holiday rules and applies them to different years.
Calendar Highlights
Calendar highlights leverage calendar patterns to render outlines and fills around groupings of cells. They can be added, modified, and removed in real-time with a powerful FP API. This allows more advanced abilities such as cursor selection in a date range picker. The year and quarter calendar views add a highlight by default to delineate month outlines. These outlines and highlights are fully customizable to meet your visualization needs.
CSV loading/parsing utility
The window.fetch() function can be referenced through JSC.fetch() and is also supported in IE11 through a polyfill.
The JSC.parseCsv(text) function splits CSV text into rows and columns, detects and separates header rows, and parses values into string or numeric values automatically.
And more…
- Logarithmic scales
- AxisTick placement


